. 2025 Apr 10;16(1):3422.
doi: 10.1038/s41467-025-58706-5.

FFAR4-mediated IL-6 release from islet macrophages promotes insulin secretion and is compromised in type-2 diabetes

Affiliations

FFAR4-mediated IL-6 release from islet macrophages promotes insulin secretion and is compromised in type-2 diabetes

Xinyi Chen et al. Nat Commun. .

Abstract

The function of islet macrophages is poorly understood. They promote glucose-stimulated insulin secretion (GSIS) in lean mice, however, the underlying mechanism has remained unclear. We show that activation of the free fatty acid receptor FFAR4 on islet macrophages leads to interleukin-6 (IL-6) release and that IL-6 promotes β-cell function. This mechanism is required for GSIS in lean male mice, but does not function anymore in islets from people with obesity and obese type 2 diabetic male mice. In islets from obese mice, FFAR4 downstream signaling in macrophages is strongly reduced, resulting in impaired FFAR4-mediated IL-6 release. However, IL-6 treatment can still improve GSIS in islets from people with obesity and obese type 2 diabetic mice. These data show that a defect in FFAR4-mediated macrophage activation contributes to reduced GSIS in type 2 diabetes and suggest that reactivating islet macrophage FFAR4 and promoting or mimicking IL-6 release from islet macrophages improves GSIS in type 2 diabetes.


Conflict of interest statement

Competing interests: The authors declare no competing interests.

Figures
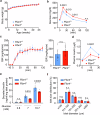
Fig. 1
Fig. 1. Ffar4-/- mice show decreased glucose-stimulated insulin secretion.
a Body weight of wild-type (Ffar4+/+, n = 11) and FFAR4 knockout (Ffar4-/-, n = 9) mice fed with normal-chow diet. b Blood glucose levels at the indicated time points after glucose injection in Ffar4+/+ (n = 11) and Ffar4-/- (n = 10) mice. c Glucose infusion rate (GIR) in hyperinsulinemic-euglycemic clamp experiments in Ffar4+/+ and Ffar4-/- mice (n = 10). The bar diagram shows the steady-state GIR during the last 30 mins. d Plasma insulin levels at the indicated time points after glucose injection in Ffar4+/+ (n = 10) and Ffar4-/- (n = 9) mice. e Insulin secretion from islets isolated from Ffar4+/+ and Ffar4-/- mice (n = 6) at different glucose levels. Results were normalized to islet protein levels. f Size distribution of the islets isolated from Ffar4+/+ and Ffar4-/- mice (n = 3). Shown are mean values ± SEM; P-values are given in the figure; n.s.: not significant (Bonferroni’s two-way ANOVA test (a, b, c (left panel), df), unpaired non-parametric two-tailed Mann-Whitney U test (c (right panel)). Source data are provided as a Source Data file.
Fig. 2
Fig. 2. FFAR4 in islet macrophages is required for normal GSIS.
a Integrated glucose plasma levels over time after glucose injection in the indicated mouse lines. Shown is the area under curve (AUC) of the glucose tolerance tests shown in Supplementary Fig. 2. b Body weight of Ffar4flox/flox (control, n = 11) and LysM-Cre;Ffar4flox/flox (My-Ffar4-KO, n = 12) mice fed with normal-chow diet. c Blood glucose levels after glucose injection in control and My-Ffar4-KO mice (n = 12). d Glucose infusion rate (GIR) in hyperinsulinemic-euglycemic clamp experiments in control and My-Ffar4-KO mice (n = 11). The bar diagram shows the steady-state GIR during the last 30 mins. e Plasma insulin levels after glucose injection in control and My-Ffar4-KO mice (n = 11). f Insulin secretion from islets isolated from control and My-Ffar4-KO mice (n = 10) at different glucose levels (left panel). Results were normalized to islet protein levels. The right panel shows the total insulin content in islets (n = 5). g Size distribution of islets isolated from control and My-Ffar4-KO mice (n = 3). h Body weight of Ffar4flox/flox (n = 12) and Csf1r-Cre;Ffar4flox/flox (n = 10) mice fed with normal-chow diet. i Blood glucose levels after glucose injection in Ffar4flox/flox (n = 11) and Csf1r-Cre;Ffar4flox/flox (n = 10) mice. j Plasma insulin levels after glucose injection in Ffar4flox/flox (n = 8) and Csf1r-Cre;Ffar4flox/flox (n = 6) mice. k Insulin secretion at different glucose levels from islets isolated from Ffar4flox/flox and Csf1r-Cre;Ffar4flox/flox mice (n = 7/7/8/7/7/8). Results were normalized to islet protein levels. l Effect of TUG-891 on insulin secretion from islets isolated from control and My-Ffar4-KO mice at different glucose levels (n = 8/8/8/8/7/8/8/8/8/8/8/8). Results were normalized to islet protein levels. m Representative image of islet sections from Ffar4+/- (n = 4) mice expressing β-galactosidase under the control of Ffar4 promoter stained for galactosidase activity and macrophages. The bar diagram shows the percentage of β-gal-positive cells of all F4/80-positive (macrophage) cells. Bar length: 50 μm. Shown are mean values ± SEM; P-values are given in the figure; n.s.: not significant (unpaired parametric two-tailed Student’s t test (a, f (right pane)), Bonferroni’s two-way ANOVA test (b, c, d (left panel), e, f (left panel), g-l), unpaired non-parametric two-tailed Mann-Whitney U test (d (right panel)). Source data are provided as a Source Data file.
Fig. 3
Fig. 3. Islet macrophage FFAR4 mediates release of IL-6.
a Determination of cytokines released from pancreatic islets isolated from wild-type (n = 4) mice. Islets were treated without (control) or with TUG-891 for 48 hrs. Thereafter, cytokine levels in the supernatant were determined by the Luminex MAGPIX Multiplexing System. Results were normalized to islet protein levels. b IL-6 release from islets isolated from control and My-Ffar4-KO mice (n = 8, left panel). Islets were treated without or with TUG-891 for the indicated time periods, and the IL-6 levels in the supernatant were determined by ELISA. The right panel shows the total IL-6 content in islets isolated from control and My-Ffar4-KO mice (n = 4). Results were normalized to the islet protein level. c IL-6 release from islets isolated from Gnaqflox/flox;Gna11-/- (control) and LysM-Cre;Gnaqflox/flox;Gna11-/- (My-q/11-KO) mice (n = 6). Islets were treated without or with TUG-891 for 2 hrs. As indicated, in some groups, islets were pre-treated with pertussis toxin (PTX) for 16 hrs. The IL-6 levels in the supernatant were determined by ELISA. Results were normalized to islet protein levels. d Il6 mRNA level in islet macrophages and β-cells isolated by FACS from wild-type mice (n = 6). All data were normalized to GAPDH and were expressed relative to the average level in islet macrophages. e IL-6 release from islets isolated from Il6flox/flox (n = 7) and Cd11c-Cre;Il6flox/flox (n = 8) mice. Islets were treated without or with TUG-891 for 48 h, and the IL-6 levels in the supernatant were determined by ELISA. Results were normalized to the islet protein level. f Effect of TUG-891 on insulin secretion from islets isolated from Il6flox/flox (n = 7) and Cd11c-Cre;Il6flox/flox (n = 8) mice in the presence of 7 mM or 16.7 mM glucose. Results were normalized to islet protein levels. g Blood glucose levels after glucose injection in Il6flox/flox (n = 7) and Cd11c-Cre;Il6flox/flox (n = 8) mice. h Plasma insulin levels after glucose injection in Il6flox/flox (n = 7) and Cd11c-Cre;Il6flox/flox (n = 8) mice. Shown are mean values ± SEM; P-values are given in the figure (unpaired non-parametric two-tailed Mann-Whitney U test (a), Bonferroni’s two-way ANOVA test (b (left panel), c, eh), unpaired parametric two-tailed Student’s t test (b (right panel), d). Source data are provided as a Source Data file.
Fig. 4
Fig. 4. IL-6 promotes GSIS in β-cells.
a Effect of IL-6 on insulin secretion from islets isolated from control and My-Ffar4-KO mice (n = 9/10/10/9/10/9/10/9). Islets were incubated without or with IL-6 for 24 hrs in the presence of 7 or 16.7 mM glucose. Results were normalized to islet protein levels. b Body weight of Il6raflox/flox (Control, n = 10) and Ins1-CreERT2;Il6raflox/flox (β-cell-Il6ra-KO, n = 11) mice fed with normal-chow diet. c Blood glucose levels after glucose injection in control (n = 11) and β-cell-Il6ra-KO (n = 10) mice. d Plasma insulin levels after glucose injection in control (n = 8) and β-cell-Il6ra-KO (n = 7) mice. e Insulin secretion from islets isolated from control and β-cell-Il6ra-KO mice in the presence of 7 or 16.7 mM glucose (n = 9/8/9/7). Results were normalized to islet protein levels. f, g Effect of TUG-891 (f; n = 10/9/10/7/10/9/10/7) or IL-6 (g; n = 8/8/8/7/8/8/9/7) on insulin secretion from islets isolated from control and β-cell-Il6ra-KO mice in the presence of 7 or 16.7 mM glucose. For the effect of IL-6, islets were incubated without or with IL-6 for 24 h. Results were normalized to islet protein levels. h Schematic representation of the mechanism underlying FFAR4-mediated islet macrophage activation resulting in the release of IL-6, which then promotes insulin secretion from β-cells. FFA, free fatty acid. Shown are mean values ± SEM; P-values are given in the figure; n.s.: not significant (Bonferroni’s two-way ANOVA test (ad, f, g), unpaired parametric two-tailed Student’s t test (e)). Source data are provided as a Source Data file.
Fig. 5
Fig. 5. FFAR4-mediated IL-6-dependent insulin secretion is compromised in type-2 diabetic mice.
a Body weight of Ffar4flox/flox (control, n = 12) and LysM-Cre;Ffar4flox/flox (My-Ffar4-KO, n = 11) mice fed with high-fat diet (HFD). b Blood glucose levels after glucose injection in control (n = 12) and My-Ffar4-KO (n = 11) mice fed with HFD. c Body weight of Il6raflox/flox (control, n = 6) and Ins1-CreERT2;Il6raflox/flox (β-cell-Il6ra-KO, n = 8) mice fed with HFD. d Blood glucose levels after glucose injection in control (n = 6) and β-cell-Il6ra-KO (n = 8) mice fed with HFD. e Numbers of islet F4/80+ cells (macrophages) from wild-type mice (n = 6) fed with either normal-chow diet (ND) or HFD. f and g, Ffar4 (f), and Il6 (g) mRNA levels in islet macrophages isolated from ND- or HFD-fed wild-type mice (n = 6). All data were normalized to GAPDH and were expressed relative to the average level in macrophages from mice fed with ND. h TUG-891-induced IL-6 release from islets from wild-type mice (n = 8) fed with either ND or HFD (left panel). The right panel shows the total islet IL-6 content from ND- or HFD-fed wild-type mice (n = 5). Results were normalized to islet protein levels. i and j, Effect of TUG-891 (i; n = 8) or IL-6 (j; n = 8/6/7/6/8/6/7/6) on insulin secretion from islets isolated from wild-type mice fed with either ND or HFD at different glucose levels. Results were normalized to islet protein levels. k TUG-891-induced changes in the intracellular Ca2+ concentration ([Ca2+]i) in islet macrophages from wild-type mice fed with either ND or HFD. Arrows indicate the time point when TUG-891 or ionomycin was added. The data are shown as % of peak response to ionomycin. The bar diagram shows the area under the curve (AUC) of TUG-891-induced Ca2+ transients as % of the ionomycin-induced Ca2+ transient. 46 islet macrophages from ND-fed mice (n = 3) and 49 islet macrophages from HFD-fed mice (n = 3) were analyzed. Shown are mean values ± SEM; P-values are given in the figure; n.s.: not significant (Bonferroni’s two-way ANOVA test (ad, h (left panel), ik (left panel)), unpaired parametric two-tailed Student t test (eh (right panel)), unpaired non-parametric two-tailed Mann-Whitney U test (k (right panel)). Source data are provided as a Source Data file.
Fig. 6
Fig. 6. FFAR4-mediated IL-6-dependent insulin secretion is compromised in type-2 diabetic patients.
a Insulin secretion from islets isolated from pancreata of healthy (n = 9) and type-2 diabetic (n = 9) donors in the presence of 5.6 or 16.7 mM glucose after incubation without or with 20 µM TUG-891. Results were normalized to islet protein levels. b IL-6 release from islets isolated from pancreata of healthy (n = 9) and type-2 diabetic (n = 9) donors. Islets were treated without or with 20 µM TUG-891 for 48 h, and the IL-6 levels in the supernatant were determined by ELISA. Results were normalized to islet protein levels. c Insulin secretion from islets isolated from pancreata of healthy (n = 9) and type-2 diabetic (n = 9) donors in the presence of 5.6 or 16.7 mM glucose after incubation with or without 10 µM IL-6 for 24 hrs. Results were normalized to islet protein levels. Shown are mean values ± SEM; P-values are given in the figure; n.s.: not significant (Bonferroni’s two-way ANOVA test (ac)). Source data are provided as a Source Data file.

Similar articles

Cited by

References

    1. Petersen, M. C. & Shulman, G. I. Mechanisms of insulin action and insulin resistance. Physiol. Rev.98, 2133–2223 (2018). - PMC - PubMed
    1. White, M. F. & Kahn, C. R. Insulin action at a molecular level − 100 years of progress. Mol. Metab.52, 101304 (2021). - PMC - PubMed
    1. Rorsman, P. & Braun, M. Regulation of insulin secretion in human pancreatic islets. Annu. Rev. Physiol75, 155–179 (2013). - PubMed
    1. Campbell, J. E. & Newgard, C. B. Mechanisms controlling pancreatic islet cell function in insulin secretion. Nat. Rev. Mol. Cell Biol.22, 142–158 (2021). - PMC - PubMed
    1. Simpson, N. et al. Dopamine-mediated autocrine inhibitory circuit regulating human insulin secretion in vitro. Mol. Endocrinol.26, 1757–1772 (2012). - PMC - PubMed

MeSH terms

LinkOut - more resources