. 2025 Apr 10;16(1):3409.
doi: 10.1038/s41467-025-58619-3.

An unconventional autophagic pathway that inhibits ATP secretion during apoptotic cell death

Affiliations

An unconventional autophagic pathway that inhibits ATP secretion during apoptotic cell death

Elena Terraza-Silvestre et al. Nat Commun. .

Abstract

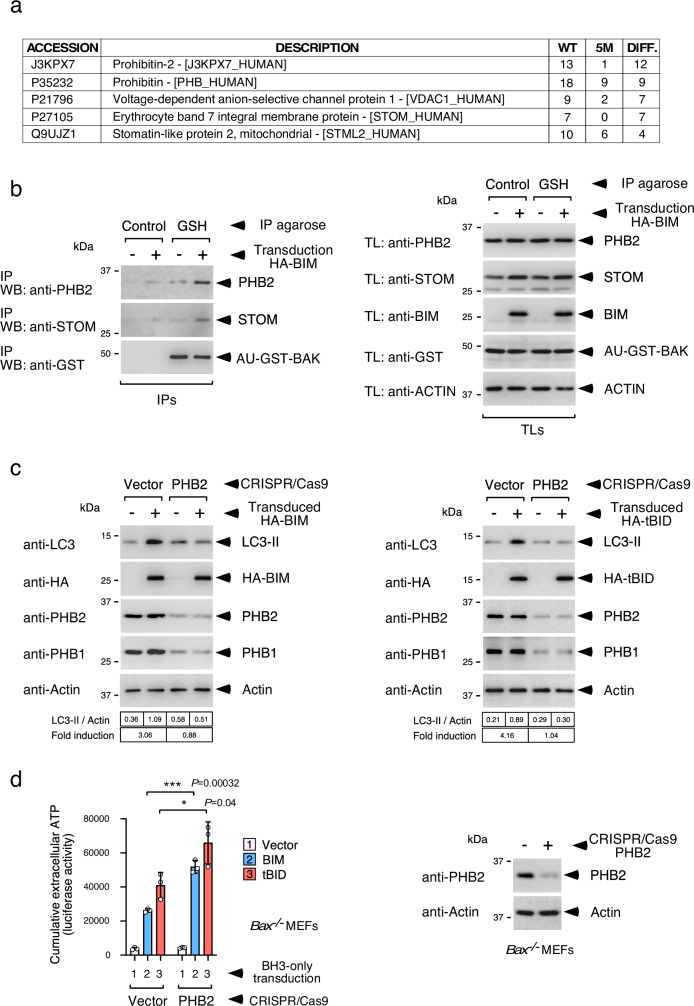
Mobilisation of Damage-Associated Molecular Patterns (DAMPs) determines the immunogenic properties of apoptosis, but the mechanisms that control DAMP exposure are still unclear. Here we describe an unconventional autophagic pathway that inhibits the release of ATP, a critical DAMP in immunogenic apoptosis, from dying cells. Mitochondrial BAK activated by BH3-only molecules interacts with prohibitins and stomatin-1 through its latch domain, indicating the existence of an interactome specifically assembled by unfolded BAK. This complex engages the WD40 domain of the autophagic effector ATG16L1 to induce unconventional autophagy, and the resulting LC3-positive vesicles contain ATP. Functional interference with the pathway increases ATP release during cell death, reduces ATP levels remaining in the apoptotic bodies, and improves phagocyte activation. These results reveal that an unconventional component of the autophagic burst that often accompanies apoptosis sequesters intracellular ATP to prevent its release, thus favouring the immunosilent nature of apoptotic cell death.


Conflict of interest statement

Competing interests: The authors declare no competing interests.

Figures

Fig. 1
Fig. 1. BH3-only activators induce BAK-dependent autophagy.
a The indicated strains of MEFs were transduced with retroviruses expressing the shown BH3-only molecules and treated with 25 μM zVAD.fmk 7 h later. Cells were lysed 22 h post-transduction for Western blot against the indicated molecules. Expression levels of HA tagged tBID, BIM and PUMA were measured in DKO cells to minimise the possible impact of cell death (right panel). b MEFs expressing GFP-LC3 were retrovirally transduced as in (a) and fixed 22 h later for microscopy. Shown are representative confocal pictures (left panel; green channel: GFP-LC3, blue channel: DAPI; scale bars represent 10 μm), and quantification of the number of GFP-LC3 puncta per cell (right panel, top) and the percentage of cells showing induced GFP-LC3 (right panel, bottom). Graph bars indicate control vector (pink), tBID (red), BIM (blue) or PUMA (green) retroviral transduction. Graphs represent mean values −/+ s.d. of triplicate scoring points (n = 3 microscopy fields, each including at least 25 cells per field; **P < 0.01, ***P < 0.001, ****P < 0.0001 two-tailed Student’s t-test). Numeric P-values are shown. c Bax-/- MEFs were retrovirally transduced as in (a) and treated with E64d and pepstatin (10 μg/ml each) for the last 16 h of culture. Cells were lysed 22 h post-transduction for Western blot using the indicated antibodies. d BAK expression in reconstituted DKO MEFs. The indicated MEF strains along with DKO MEFs retrovirally transduced with WT or L78E human BAK versions and subsequently selected in puromycin were lysed for Western blotting. e The reconstituted MEFs shown in (d) were retrovirally transduced as in (a) and lysed 22 h later for Western blot against the shown molecules. Source data are provided as a Source Data file.
Fig. 2
Fig. 2. The autophagic response triggered in BAX-deficient cells requires the WD40 domain of ATG16L1.
a Bax-/- MEFs were transduced with a CRISPR/Cas9 lentivirus expressing the indicated sgRNAs against Atg16l1 (#1 and #2), selected in puromycin and lysed for Western blot. b Cells targeted by sgRNA #2 were transduced with a retrovirus expressing the ATG16L1 Nt region (1-299), and lysed along CRISPR/Cas9 control cells for Western blot. c The engineered Bax-/- MEFs shown in (a, b) were treated with bafilomycin (80 nM; left panel) or rapamycin (2 μM) plus E64d/pepstatin (10 μg/ml each; right panel) for 8 h and lysed for Western blot. d The engineered Bax-/- MEFs shown in (a, b) were retrovirally transduced with the shown BH3-only activators, supplemented with 25 μM zVAD.fmk 7 h later, and lysed 20 h post-transduction for Western blot against the indicated molecules. e The indicated Bax-/- MEFs engineered for ATG16L1 expression were transduced as in (d) and fixed for anti-LC3 immunofluorescence 17 h later. Shown are representative confocal pictures (left; red: LC3, blue: DAPI; scale bars represent 10 μm), and quantification of the number of LC3-positive puncta per cell (right). Data are presented as box-plots where the central line represents the median value, the box shows percentiles 25-75 and the whiskers include the most extreme values (n = 25 cells; ****P < 0.0001 two-tailed Student’s t-test). Numeric P-values are shown. f The indicated Bax-/- MEFs engineered for ATG16L1 expression were treated with 2 μM MTX in the presence of 25 μM zVAD.fmk and lysed 14 h later for Western blot against the shown molecules. g The indicated engineered Bax-/- MEFs expressing Cherry-LC3 were treated as in (f) and processed for microscopy 14 h later. Shown are representative confocal pictures (left; red: Cherry-LC3, blue: DAPI; scale bars represent 10 μm), and quantification of the number of Cherry-LC3-positive puncta per cell (right). Graph bars indicate control (yellow) and MTX (orange) treatment. Data are presented as in (e) (n = 25 cells; ****P < 0.0001 two-tailed Student’s t-test). Numeric P-values are shown. Source data are provided as a Source Data file.
Fig. 3
Fig. 3. Ultrastructural characterisation of the LC3-positive vesicles induced by BIM.
a Anti-GFP immuno-EM of GFP-LC3-positive vesicles. Bax-/- MEFs expressing GFP-LC3 were transduced with BIM, treated 7 h later with 25 μM zVAD.fmk, and processed 17 h post-transduction for anti-GFP immuno-EM microscopy. Panels display four examples of clusters of GFP-LC3-positive, small, single-membrane vesicles and tubules. Two insets are presented for each example. White arrows point to single-membrane structures. The bottom panels show mitochondria labelled with GFP-LC3 (left), mitochondria engulfed by a GFP-LC3-positive autophagosome (mitophagy; middle) and GFP-LC3-positive tubes consistent with ER cisternae (right). Images of control Bax-/- MEFs transduced with empty vector and Bak-/- MEFs transduced with vector or BIM are shown in Supplementary Fig. 6d. b CLEM of the GFP-LC3-positive vesicles. Bax-/- MEFs expressing GFP-LC3 were treated as in (a) and processed for CLEM. Shown are three examples of perinuclear GFP-LC3-positive vesicle clusters present in the same cell at different z positions. The cell perimeter revealed in GFP-overexposed images was used for initial alignment between the optical and EM images (left panels). The top plane (height 1120 nm) includes de nucleus (DAPI), which was used for further alignment (top panels). The middle (360 nm) and bottom (260 nm) planes did not include the nucleus and shared one of the clusters. Peculiar surface cell features were used for finer alignment (black arrows). Random canonical autophagosomes colocalize with GFP-LC3 (white arrows; shown in Supplementary Fig. 6e). An incipient autophagosomal structure appears in the periphery of the top cluster (red asterisk). Yellow arrows point to single-membrane structures. The three examples show that the GFP-LC3-positive clusters are formed by small, irregular vesicles and tubules limited by one membrane.
Fig. 4
Fig. 4. The unconventional autophagic response generates Cherry-LC3/quinacrine double-positive vesicles and inhibits ATP release during cell death.
ad Induction of Cherry-LC3/quinacrine double-positive vesicles in Bax-/- cells expressing full-length ATG16L1 but not in those expressing ATG16L1-ΔWDD. a Bax-/- MEFs engineered for ATG16L1 expression and expressing Cherry-LC3 were transduced with the indicated BH3-only molecules and treated with 25 μM zVAD.fmk 7 h later. Cells were stained with quinacrine 17 h post-transduction and analysed in vivo by confocal microscopy. Shown are representative confocal pictures (Ch-LC3: Cherry-LC3 (magenta); Quin.: quinacrine (green)). Scale bars represent 10 μm. bd Quantification of the phenotypes shown in (a). Graphs display the number of Cherry-LC3-positive puncta per cell (b), the number of quinacrine-positive puncta per cell (c), and the percentage of Cherry-LC3-positive signal that colocalizes with the quinacrine-positive signal (d). Data are presented as box-plots where the central line represents the median value, the box shows percentiles 25-75 and the whiskers include the most extreme values (n = 25 cells; ****P < 0.0001 two-tailed Student’s t-test). Numeric P-values are shown. e Increased levels of ATP released by apoptotic Bak-/- MEFs. The shown MEF strains were transduced with the indicated BH3-only molecules for 22 h (left), or treated with MTX (2 μM) for 24 h (right), and the levels of extracellular ATP measured at 14 and 22 h (BH3-only molecules) or 16 and 24 h (MTX). Graphs show mean values −/+ s.d. of cumulative data resulting from the sum of the luciferase activity units obtained at both time points from triplicate experimental points (n = 3 biological replicas; *P < 0.05, **P < 0.01, ***P < 0.001, ****P < 0.0001 two-tailed Student’s t-test). Numeric P-values are shown. f Increased levels of ATP released by apoptotic Bak-/- MEFs expressing ATG16L1-ΔWDD. Bax-/- MEFs engineered for ATG16L1 expression were transduced with the shown BH3-only molecules (left) or treated with MTX (right), and the levels of extracellular ATP measured and displayed as in (e). Source data are provided as a Source Data file.
Fig. 5
Fig. 5. The BAK latch domain induces LC3 lipidation.
a BAK scheme showing relevant amino acid positions for the constructs used in (b). b HEK-293T cells were transfected with AU-BAK-ΔBH3 constructs (Nt: M1-M71; Nt-core-ΔBH3: M1-G146 lacking G72-R88 (BH3); latch: G146-G186; all including the transmembrane (TM) domain: P187-S211) and HA-LC3, and lysed 36 h later for Western blot. Relative densitometric quantifications of LC3-II are shown (bottom). c HeLa cells were transfected with the indicated BAK constructs and GFP-LC3, and processed for microscopy 36 h later. Shown are representative confocal pictures (left; green: GFP-LC3, blue: DAPI; scale bars represent 10 μm), and quantification of the number of GFP-LC3-positive puncta per cell (right). Graph bars indicate control vector (white), BAK-ΔBH3 (light grey) and BAK-latch domain (dark grey). Data are displayed as box-plots where the central line represents the median value, the box shows percentiles 25-75 and the whiskers include the most extreme values (n = 25 cells; n.s. P > 0.05, two-tailed Student’s t-test). The numeric P-value is shown. d Alignment of the BAK and BCLXL latch domains showing functionally conserved (red font) and identical (red boxes) amino acids. Positions of the BH2 domains and α6 and α7 helices of BAK are indicated. e HEK-293T cells were transfected with the shown GFP-BAK/BCLXL latch chimeric constructs (right) and HA-LC3, and lysed 36 h later for Western blotting (left). f Scheme showing wild-type and 5M BAK latch domain versions. Boxed positions in the 5M version indicate BCLXL residues (ND-LEP) that substitute those present in BAK (LH-CIA). g HEK-293T cells were transfected with WT and 5M GFP-BAK-latch constructs and HA-LC3, and lysed 36 h later for Western blot. h HeLa cells were transfected with WT and 5M GST-BAK latch versions and GFP-LC3, and processed for microscopy 36 h later. Shown are representative confocal pictures (left; green: GFP-LC3, blue: DAPI; scale bars represent 10 μm), and quantification of the number of GFP-LC3-positive puncta per cell (right). Graph bars indicate control vector (white), BAK-latch-WT (light grey) and BAK-latch-5M (dark grey). Data displayed as in (c) (n = 25 cells; ****P < 0.0001 two-tailed Student’s t-test). Source data are provided as a Source Data file.
Fig. 6
Fig. 6. A BAK-nucleated complex including PHB1/2 and STOM mediates BAK-induced autophagy and inhibits ATP secretion during apoptosis.
a Selected list of prohibitin-family proteins and VDAC1 identified as potential latch interactors. The number of peptides identified in the WT and 5M proteomics samples, and their difference between both samples (DIFF.), are indicated. b Co-immunoprecipitation assay showing interaction between activated GST-BAK and PHB2/STOM in response to BIM. DKO MEFs depleted of CASP3 and CASP9 and expressing GST-BAK (and also human PHBs and STOM for increased detectability) were retrovirally transduced with HA-BIM and, 15 h later, crosslinked with 1% paraformaldehyde and lysed. Lysates were incubated with control or GSH-agarose beads and the resulting precipitates subjected to Western blot (left panel, IPs). Expression levels of all contenders in total protein lysates are shown on the right panel (TLs). c PHBs mediate the autophagic response induced by BIM (left panel) and tBID (right panel). Bax-/- MEFs were transduced with the shown CRISPR/Cas9 constructs and, 40 h later, with the indicated BH3-only molecules. Cells were treated with 25 μM zVAD.fmk 7 h later and lysed 20 h post-transduction for Western blot. Relative densitometric quantifications of LC3-II are shown at the bottom. d PHBs inhibit ATP secretion during BH3-only-induced apoptosis. Bax-/- MEFs were transduced with the shown CRISPR/Cas9 constructs and, subsequently, with the indicated BH3-only molecules (as in c) for 22 h, and the levels of extracellular ATP were measured at 14 and 22 h. Graph shows mean values −/+ s.d. of cumulative data resulting from the sum of the luciferase activity units obtained at both time points from triplicate experimental points (n = 3 biological replicas; *P < 0.05, ***P < 0.001, two-tailed Student’s t-test). Numeric P-values are shown. Control points were lysed 48 h post-CRISPR/Cas9 transduction for Western blot to determine PHB2 depletion (right panel). Source data are provided as a Source Data file.
Fig. 7
Fig. 7. Unconventional autophagy during apoptosis reduces IL-1β release by co-cultured BMDMs.
a, b The indicated Bax-/- MEFs engineered for ATG16L1 expression were transduced with BH3-only proteins (a) or treated with 2 μM MTX (b) and, 7 h later, supplemented with the ecto-ATPase inhibitor ARL67156 (3 μM). Apoptotic cells were collected 20 h (a) or 22 h (b) later and added to BMDMs pre-activated with LPS (100 ng/ml, 4 h). After 6 h, the supernatant was tested for IL-1β (ELISA). Graphs show mean values of IL-1β concentration −/+ s.d. of triplicate experimental points (n = 3 biological replicas; n.s. P > 0.05, *P < 0.05, ***P < 0.001 two-tailed Student’s t-test). Numeric P-values are shown. c P2X7 inhibitors reduce IL-1β secretion by BMDMs. Engineered Bax-/- MEFs expressing ATG16L1-Nt were treated as in (a) and the apoptotic bodies added to BMDMs pre-incubated for 45 min with control medium (condition 1) or the P2X7 channel inhibitors KN-62 (condition 2) and JNJ (condition 3), as indicated. After 6 h, supernatants were tested for IL-1β. Graphs show data as in (a) (n = 3; *P < 0.05, **P < 0.01, ***P < 0.001 two-tailed Student’s t-test). Numeric P-values are shown. d Secretion of mature IL-1β from BMDMs cultured with dying MEFs expressing ATG16L1-Nt (top) or HCT116 cells harbouring split ATG16L1 (bottom). BMDMs were incubated as in (a) with apoptotic bodies of the indicated cells transduced with tBID. Supernatants were collected 6 h later for anti-IL1β immunoprecipitation plus anti-IL-1β Western blot (top, MEFs) or directly subjected to anti-IL-1β Western blot (bottom; HCT116 cells). ATP-treated BMDMs (5 mM, 30 min) provide a positive control. Crossreactive bands of the immunoprecipitating antibody (Ig) confirm equal loading (top). e Increased caspase-1 (Casp-1) cleavage in BMDMs cultured with dying MEFs expressing ATG16L1-Nt. BMDMs were treated as in (d) and lysed for Western blot. f Gasdermin D inhibitor DMF reduces IL-1β secretion by BMDMs. Bax-/- MEFs expressing ATG16L1-Nt were treated as in (c) and the apoptotic bodies tested for IL-1β secretion by BMDMs in the absence or presence of DMF. Data are displayed as in (c). Green bars represent ATP treatment. Source data are provided as a Source Data file.
Fig. 8
Fig. 8. Scheme of the BAK-mediated unconventional autophagic pathway induced during apoptosis and its role in the control of ATP release.
BH3-only activators like BIM or BID engage mitochondrial BAK and trigger its unfolding at the mitochondrial surface. This initial activation step exposes the latch domain (orange), which likely crosses the OMM to bind PHBs and STOM. The resulting protein complex recruits ATG16L1 through interaction between PHBs/STOM and the ATG16L1 WD40 domain to induce formation of single-membrane, unconventional, LC3-positive vesicles. The origin of these vesicles and the detailed mechanisms of their formation remain unclear. The LC3-labelled vesicles sequester ATP and prevent ATP release during the apoptotic process, thus inhibiting the ability of the dying cells to stimulate the innate immune pathways of the recruited phagocytes.

Similar articles

References

    1. Czabotar, P. E., Lessene, G., Strasser, A. & Adams, J. M. Control of apoptosis by the BCL-2 protein family: Implications for physiology and therapy. Nat. Rev. Mol. Cell Biol.15, 49–63 (2014). - PubMed
    1. Luna-Vargas, M. P. A. & Chipuk, J. E. The deadly landscape of pro-apoptotic BCL-2 proteins in the outer mitochondrial membrane. FEBS J.283, 2676–2689 (2016). - PMC - PubMed
    1. Green, D. R. The mitochondrial pathway of apoptosis part ii: The bcl-2 protein family. Cold Spring Harb. Perspect. Biol.14, a041046 (2022). - PMC - PubMed
    1. Westphal, D., Kluck, R. M. & Dewson, G. Building blocks of the apoptotic pore: how Bax and Bak are activated and oligomerize during apoptosis. Cell Death Differ.21, 196–205 (2014). - PMC - PubMed
    1. Adams, J. M. & Cory, S. The BCL-2 arbiters of apoptosis and their growing role as cancer targets. Cell Death Differ.25, 27–36 (2018). - PMC - PubMed

MeSH terms

Substances

LinkOut - more resources