. 2025 May;21(5):472-491.
doi: 10.1038/s44320-025-00095-4. Epub 2025 Apr 10.

Constraints on the optimization of gene product diversity

Affiliations

Constraints on the optimization of gene product diversity

Daohan Jiang et al. Mol Syst Biol. 2025 May.

Abstract

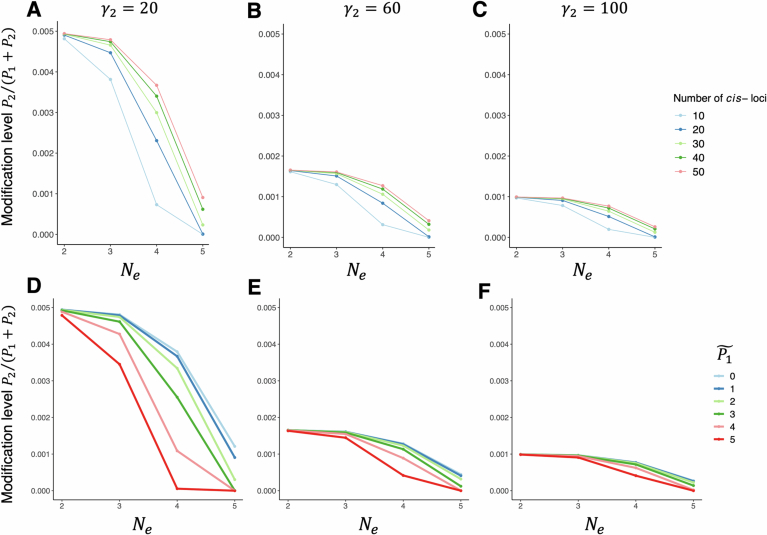
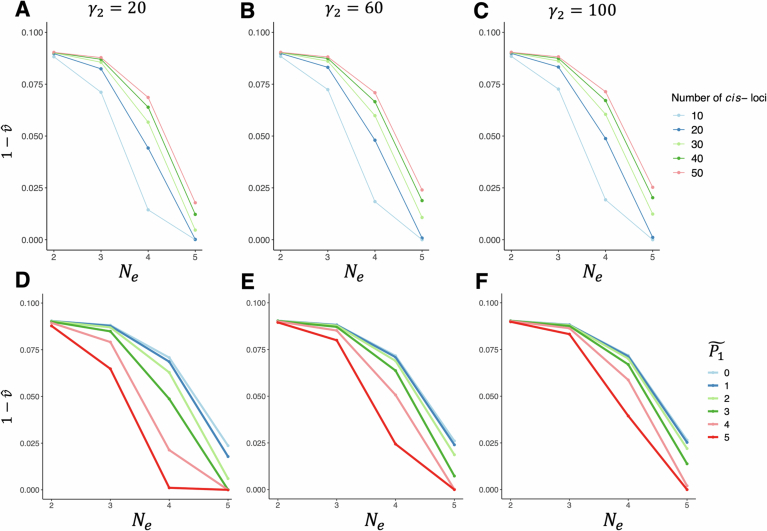
RNA and proteins can have diverse isoforms due to post-transcriptional and post-translational modifications. A fundamental question is whether these isoforms are mostly beneficial or the result of noisy molecular processes. To assess the plausibility of these explanations, we developed mathematical models depicting different regulatory architectures and investigated isoform evolution under multiple population genetic regimes. We found that factors beyond selection, such as effective population size and the number of cis-acting loci, significantly influence evolutionary outcomes. We found that sub-optimal phenotypes are more likely to evolve when populations are small and/or when the number of cis-loci is large. We also discovered that opposing selection on cis- and trans-acting loci can constrain adaptation, leading to a non-monotonic relationship between effective population size and optimization. More generally, our models provide a quantitative framework for developing statistical tests to analyze empirical data; as a demonstration of this, we analyzed A-to-I RNA editing levels in coleoids and found these to be largely consistent with non-adaptive explanations.

Keywords: Constraint; Evolutionary Theory; Gene Product Diversity; Optimization; Post-transcriptional Modification.


Conflict of interest statement

Disclosure and competing interests statement. The authors declare no competing interests.

Figures

Figure 1
Figure 1. Illustration of the processes leading to gene product diversity.
A schematic illustration of editing-type (A) and splicing-type (B) gene product diversity. (A) An unmodified isoform (I0) is enzymatically converted to a modified isoform (I1). The net per-molecule conversion rate (β) is determined jointly by a trans-factor (enzyme performing the modification process) and a set of cis-loci (sequence motif underlying affinity between enzyme and substrate). (B) The unmodified isoform I0 can be converted into either a functional isoform (I1) or a dysfunctional isoform (I2) through the same modification process such that two conversion rates β1 and β2 are affected by the same cis-loci and trans-factor.
Figure 2
Figure 2. Mean modification level varies with population genetic environment and genetic architecture.
Scaling between mean modification level of a deleterious editing-type modification to effective population size Ne (shown in log10 scale). (AC) Response of mean modification level to Ne given different combinations of cis-loci number (l) and mutation rates (μ01, μ10), with optimal expression level P~0=exp(1) (lnP~0=1). (A) Mutational bias is towards the null allele that does not facilitate modification. (B) Mutations of two directions have equal mutation rates. (C) Mutational bias is towards the effector allele that facilitates modification. (DF) Response of mean modification level to Ne given different P~0 with l = 2 (D), l = 5 (E), and l = 10 (F) in the absence of mutational bias. All results are derived with initial cis-genotypic value v0 = 0, time of evolution T = 108 time steps, total mutation rate per cis-locus μ = μ01 + μ10 = 2 × 10−9, Q = 1, γ0 = 1, and γ1 = 1. The optimal expression level P~0 is set to be equal to P0 in the absence of modification (i.e., P~0=α/γ0) in all cases).
Figure 3
Figure 3. Coevolution of cis- and trans-acting loci when the gene product modification machinery is under opposing selection forces.
(A) Schematic illustration of the scenario. The trans-factor, while causing a number of deleterious editing-type modification events (focal modifications), also performs an essential function independent of the focal modifications. Selection against deleterious modification may act to reduce the trans-genotypic value (Q), while selection mediated by the other function(s) act to maintain an optimal value of Q (Q~). (BD) Non-monotonic response of mean of Q across lineages to Ne (shown in log10 scale) with Q under stabilizing selection and 100 genes subject to deleterious modification. Curves of different colors correspond to scenarios of strong (red) and weak (blue) selection on Q. Optimum of Q is denoted by the dashed line. All simulations started with an intermediate cis-genotypic value with the largest corresponding genotypic space. (EG) Sharing of modification events over time. Y axes represent the among-gene median of proportion of lineages (species) that share a modification event when selection on Q is strong (σQ = 2). When two curves in the same panel completely overlap, the one with the largest corresponding Ne is shown. In (B, E), l = 2 and v0 = 1; in (C, F), l = 5 and v0 = 2; in (D, G), l = 10 and v0 = 5.
Figure 4
Figure 4. Simulations of A-to-I RNA editing along the coleoid phylogeny.
Evolutionary simulations recapitulated patterns of A-to-I RNA editing in four coleoid species, the octopus (Octopus vulgaris), the bimac (O. bimaculoides), the squid (Doryteuthis pealeii), and the cuttlefish (Sepia oficianalis). (A) Phylogenetic tree of four coleoid species. (B) Neighbor-joining tree of four coleoid species based on simulated editing levels. An unrooted version is shown in (A) as it is readily comparable to (B). (C) Distribution of editing levels across genes in the octopus.
Figure EV1
Figure EV1. Mean modification level varies with population genetic environment and genetic architecture.
Scaling between mean modification level of splicing-type modification and effective population size Ne (shown in log10 scale). (AC) Response of mean modification level to Ne under different combinations of cis-loci number (l) and decay rates of the dysfunctional isoform (γ2), with optimal expression level P~1=exp(1) (lnP~1=1). (DF) Response of mean modification level to Ne under different P~1=αγ1 and γ2, with l = 50. All results are derived with initial cis-genotypic value v0 = l, with T = 108 time steps, μ01 = μ10 = 10−8, Q = 100, γ0 = 0, γ1 = 1, and P~1=α/γ1.
Figure EV2
Figure EV2. Cis-genotypic value varies with population genetic environment and genetic architecture.
Scaling between normalized mean cis-genotypic value of splicing-type modification and Ne (shown in log10 scale). Represented by the Y-axes is 1v^, which reflects the degree to which cis-genotype favors production of the dysfunction and toxic isoform I2. (AC) Response of 1v^ to Ne under different combinations of l and γ2, with optimal expression level P~1=exp(1) (lnP~1=1). (DF) Response of 1v^ to Ne under different P~1 and γ2, with l = 50. All results are derived with initial cis-genotypic value v0 = l, time of evolution T = 108 time steps, and μ01 = μ10 = 10−8, Q = 100, γ0 = 0, γ1 = 1, and P~1=α/γ1.
Figure EV3
Figure EV3. Conservation of modification events as a function of time since divergence.
(A) l = 2, v0 = 1. (B) l = 5, v0 = 2. (C) l = 10, v0 = 5. Y-axes represent among-gene median of proportion of lineages (species) that share a modification event when selection on Q is weak (σQ = 20). When two curves in the same panel completely overlap, the one with the largest corresponding Ne is shown.
Figure EV4
Figure EV4. Simulations of A-to-I RNA editing along the coleoid phylogeny.
(A) Neighbor-joining tree of four coleoid species based on simulated neutral editing levels. (B) Distribution of neutral editing levels in the octopus. (C) Neighbor-joining tree of four coleoid species based on simulated deleterious editing levels. (D) Distribution of deleterious editing levels in the octopus.

Update of

Similar articles

Cited by

References

    1. Albertin CB, Medina-Ruiz S, Mitros T, Schmidbaur H, Sanchez G, Wang ZY (2022) Genome and transcriptome mechanisms driving cephalopod evolution. Nat Commun 13(1):2427 - PMC - PubMed
    1. Alon S, Garrett SC, Levanon EY, Olson S, Graveley BR, Rosenthal JJ (2015) The majority of transcripts in the squid nervous system are extensively recoded by A-to-I RNA editing. eLife 4:e05198 - PMC - PubMed
    1. Barbosa-Morais NL, Irimia M, Pan Q, Xiong HY, Gueroussov S, Lee LJ (2012) The evolutionary landscape of alternative splicing in vertebrate species. Science 338(6114):1587–1593 - PubMed
    1. Bénitière F, Necsulea A, Duret L (2024) Random genetic drift sets an upper limit on mRNA splicing accuracy in metazoans. eLife 13:RP93629 - PMC - PubMed
    1. Birk MA, Liscovitch-Brauer N, Dominguez MJ, McNeme S, Yue Y, Hoff JD (2023) Temperature-dependent RNA editing in octopus extensively recodes the neural proteome. Cell 186(12):2544–2555 - PMC - PubMed

Substances

LinkOut - more resources