. 2025 Apr 10;8(1):596.
doi: 10.1038/s42003-025-08016-9.

The gut microbiota metabolite trimethylamine N-oxide promotes cardiac hypertrophy by activating the autophagic degradation of SERCA2a

Affiliations

The gut microbiota metabolite trimethylamine N-oxide promotes cardiac hypertrophy by activating the autophagic degradation of SERCA2a

Dongyu Lei et al. Commun Biol. .

Abstract

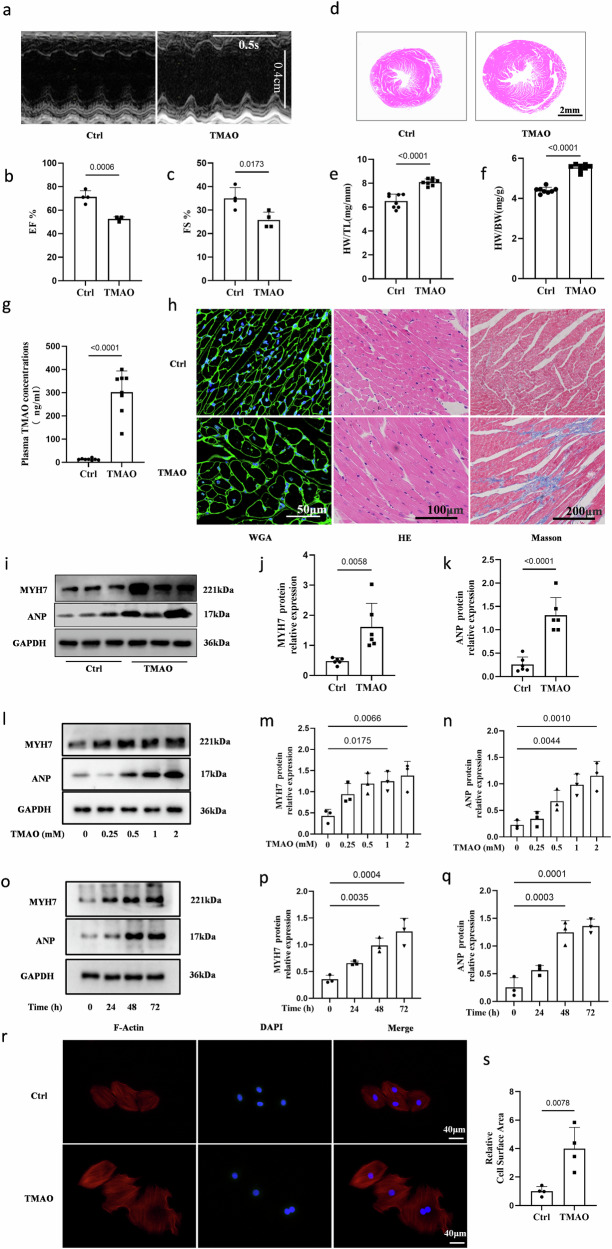
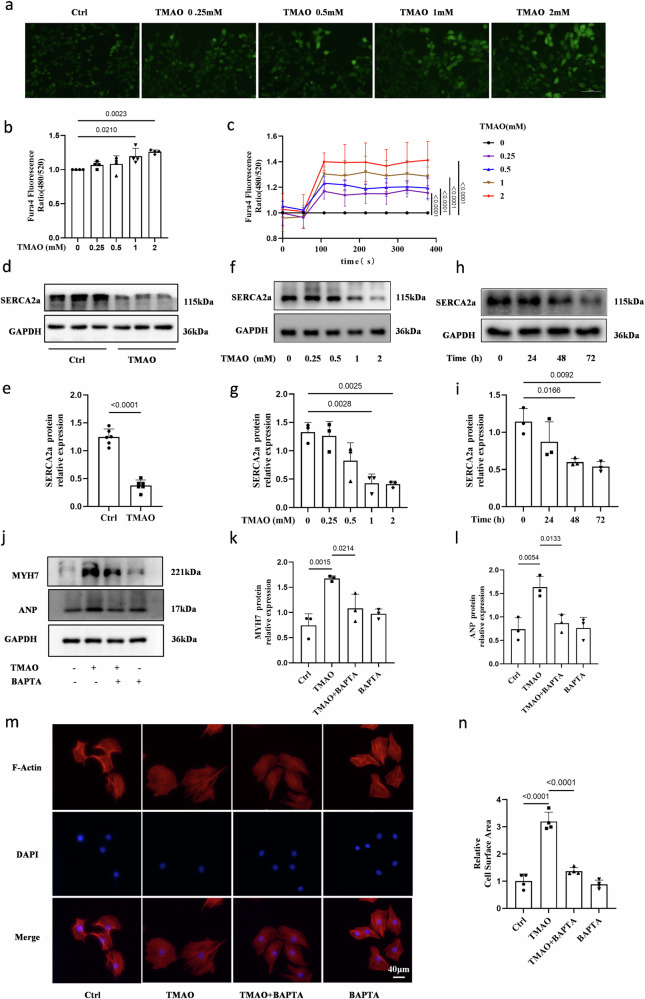
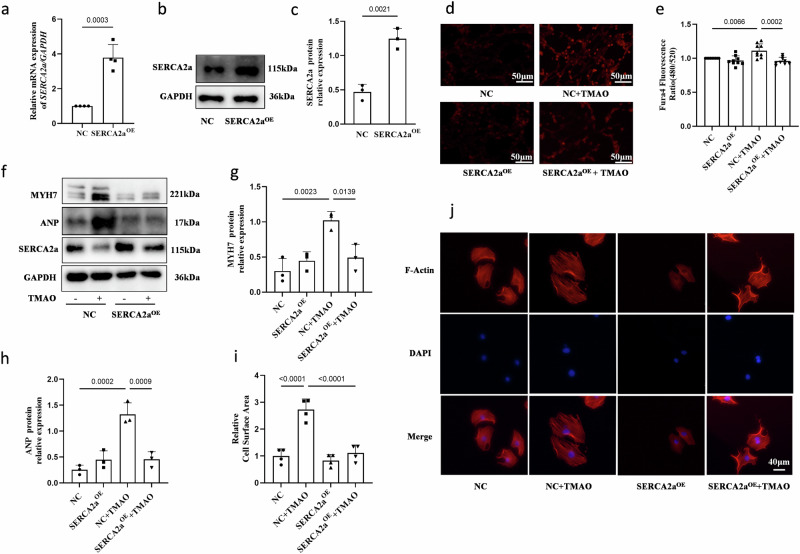
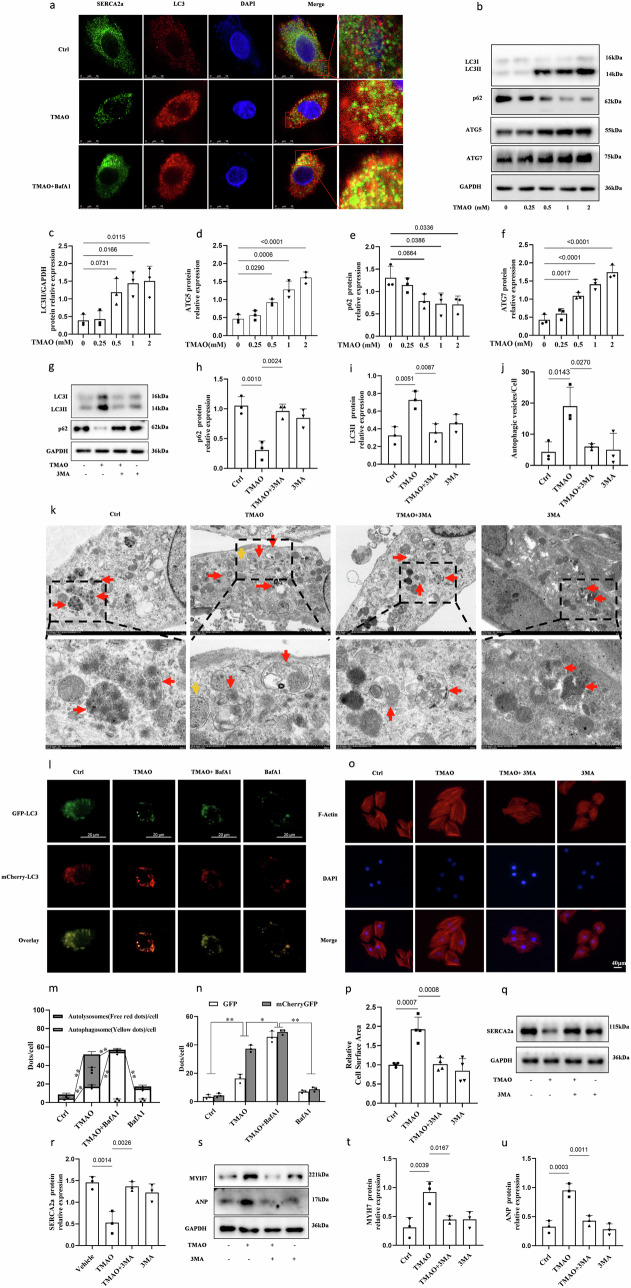
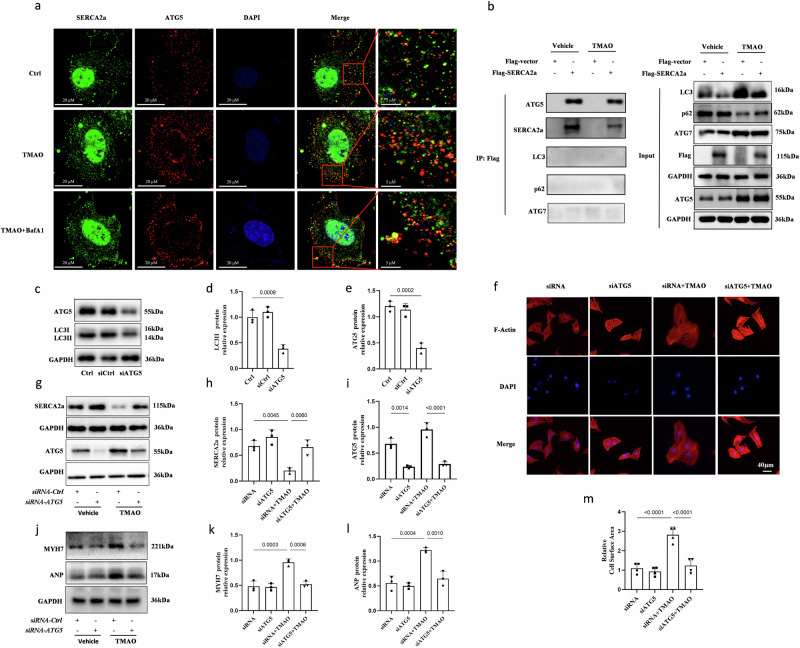
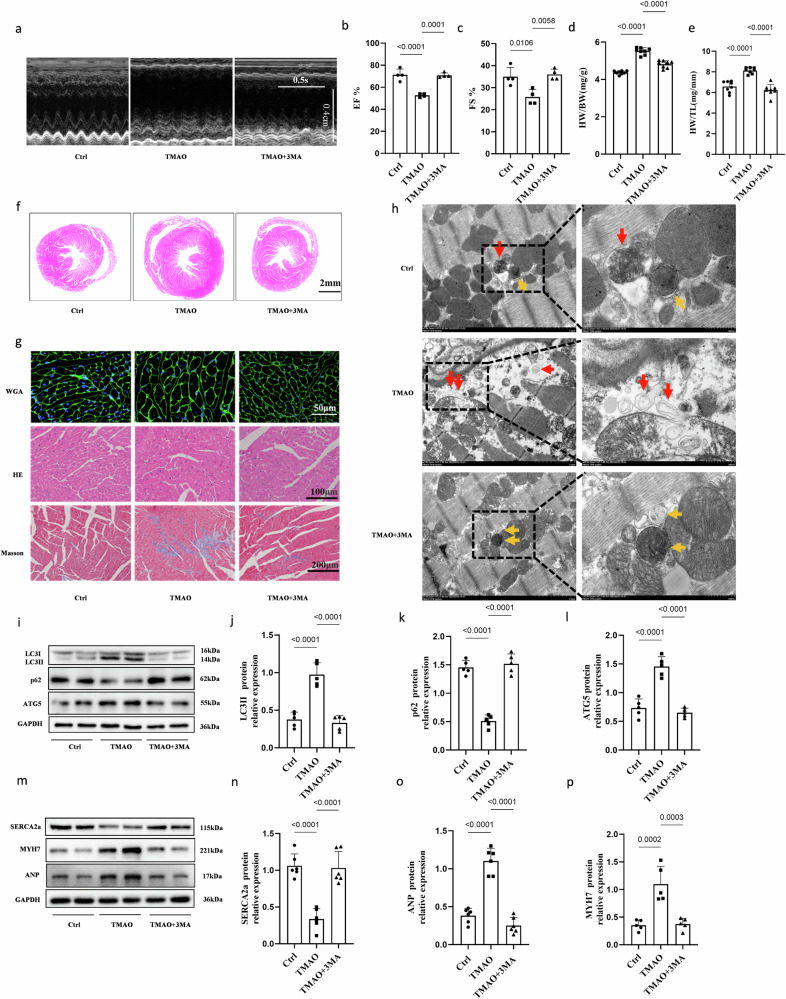
Trimethylamine oxide (TMAO) is a newly found intestinal microbiota metabolite. Here, we aimed to explore the effects of TMAO on calcium homeostasis and its implication in cardiac hypertrophy, especially focusing on the regulatory mechanism of TMAO on the key calcium transporter SERCA2a. Echocardiography and histological assessment showed that mice fed with TMAO or Choline for 8 weeks exhibited significant pathological changes of cardiac hypertrophy, which is accompanied by increased plasma levels of TMAO. The results indicated that TMAO could increase the intracellular Ca2+ level, up-regulate the expression of ANP and MYH7, and down-regulate SERCA2a expression, which could be reversed by overexpressing of SERCA2a and BAPTA-AM. Meanwhile, TMAO treatment promotes autophagy in vitro and in vivo. By employing immunofluorescence staining and immunoprecipitation assay, it was found that SERCA2a bound to ATG5 and transported to autophagosomes via the ATG5 complex for degradation under TMAO conditions. Furthermore, either 3MA or siATG5 could ameliorate TMAO-induced cardiomyocyte hypertrophy and SERCA2a degradation. Finally, in vivo intervention showed that 3MA could relieve cardiac hypertrophy and rescue the down-regulation of SERCA2a in TMAO-fed mice. The current study identifies a mechanism in which TMAO promotes cardiac hypertrophy via elevated intracellular Ca2+ levels and enhanced autophagy degradation of SERCA2a.


Conflict of interest statement

Competing interests: The authors declare no competing interests.

Figures

Fig. 1
Fig. 1. TMAO significantly induces cardiac hypertrophy in vivo and in vitro.
a Representative images of M-mode echocardiography of the left ventricle. b-c Measurement of EF% and FS%, n = 4. d Representative images of heart size photographed with a stereomicroscope. e-f HW/BW and HW/TL ratios, n = 8. g Serum TMAO concentration was determined by UPLC-MS/MS, n = 8. h Cardiac tissue size and fibrosis were detected by FITC-labeled WGA staining (60×), HE staining (40×), and Masson staining (20×). i–k Western blot analysis of ANP and MYH7 in the left ventricle tissues, n = 6. lq Western blot analysis of ANP and MYH7 in H9c2 cells treated with TMAO in different concentrations and time periods, n = 3. r, s Representative microscopic images of the cell with rhodamine-phalloidin staining of the cytoskeleton and DAPI staining of the nucleus and cell surface in H9c2 cells treated with TMAO ((1 mM for 48 h, p = 0.0078), n = 4. Statistical analyse was performed using the Student’s t-test vs. respective controls(b, c, eg, s) One-way ANOVA with Tukey’s multiple comparisons test was used to compare groups (m, n, p, q) Error bars represent S.E.M.
Fig. 2
Fig. 2. TMAO promotes the elevation of intracellular Ca2+ and declination of SERCA2a.
a, b Intracellular calcium concentration in Fura4-AM loaded H9c2 incubated with the indicated concentration of TMAO for 48 h, Scale bar is 50μm. Representative images of intracellular Ca2+ were detected with a Nikon microscope and the fluorescence ratio of intracellular Ca2+ was measured with a fluorescence microplate reader (BioTek), n = 4. c The fluorescence ratio of intracellular Ca2+ was measured with Fura4-AM by a fluorescence microplate reader (BioTek) and TMAO was added at 50 s, n = 5. d, e Western blot analysis of the SERCA2a in the left ventricle tissues (n = 6), statistical analyse was performed using the Student’s t-test vs. respective controls. fi H9c2 cells were treated with TMAO for the indicated concentration and the indicated time periods. Protein levels of SERCA2a were analyzed by western blot and quantification, n = 3. j-l H9c2 cells were pretreated with BAPTA (10 μM) for 1 h, followed by treatment with TMAO(1 mM) for another 48 h, and protein levels of ANP and MYH7 were analyzed by western blot and quantification, n = 3. m, n Representative microscopic images of cells with rhodamine-phalloidin staining of the cytoskeleton and DAPI staining of the nucleus and cell surface, n = 4, Scale bar is 40μm. One-way ANOVA with Tukey’s multiple comparisons test was used to compare groups, error bars represent S.E.M (b, c, gi, k, l, n).
Fig. 3
Fig. 3. Overexpression of SERCA2a inhibits TMAO-induced Ca2+ overload and cardiac hypertrophy.
ac SERCA2a overexpression efficacy was examined by the RT-PCR (n = 4) and Western blot (n = 3). d, e Intracellular calcium concentration in Fura4-AM loaded H9c2 infected with Ad-control or Ad-SERCA2a (SERCA2aOE) in the presence or absence of TMAO(1 mM for 48 h, n = 9), scale bar is 50 μm. Representative images of intracellular Ca2+ were detected with a Nikon microscope and the fluorescence ratio of intracellular Ca2+ was measured with a fluorescence microplate reader (BioTek). fh Western blot analysis of protein levels of ANP, MYH7, and SERCA2a in H9c2, which was infected with Ad-control (NC) or Ad-SERCA2a (SERCA2aOE) after TMAO treatment(1 mM for 48 h, n = 3). i, j H9C2 infected with Ad-control or Ad-SERCA2a in the presence or absence of TMAO (1 mM for 48 h, n = 4). Representative microscopic images of cells with rhodamine-phalloidin staining of the cytoskeleton and DAPI staining of the nucleus and cell surface area analysis. Statistical analyse was performed using the Student’s t-test vs. respective controls (a, c). One-way ANOVA with Tukey’s multiple comparisons test was used to compare groups (e, gi). Error bars represent S.E.M.
Fig. 4
Fig. 4. SERCA2a is degraded by lysosomes in TMAO-induced cardiomyocyte hypertrophy.
a, b Western blot analysis of SERCA2a and quantification in H9c2 cells treated with TMAO(1 mM) for 24 h, followed by treatment with MG132 (250, 500, 1000 nM) for 24 h, n = 3. The proteasomal substrate MCL1 serves as a control showing the effects of MG132. c, d Western blot analysis of SERCA2a and quantification in H9c2 cells treated with TMAO (1 mM) for 24 h, followed by treatment with BafA1(5, 10, 20 nM) for 24 h, n = 3. e, f Western blot analysis of SERCA2a and quantification in H9c2 cells pretreated with CQ (10 μM) for 1 h and followed by treatment with TMAO (1 mM) for another 48 h, n = 3. g Representative images of immunofluorescence detection of LAMP1 (red) and SERCA2a (green) in H9c2 cells treated with TMAO (1 mM) for 24 h, followed by treatment with BafA1(10 nM) for 24 h. Statistical analyse was performed using the One-way ANOVA with Tukey’s multiple comparisons test. Error bars represent S.E.M.
Fig. 5
Fig. 5. SERCA2a is targeted to and degraded in lysosomes via autophagy in TMAO-induced cardiac hypertrophy.
a Representative images of immunofluorescence detection of LC3 (red) and SERCA2 (green) in H9c2 cells treated with TMAO (1 mM) for 24 h, followed by treatment with BafA1(10 nM) for 24 h, n = 3. Scale bar is 10 μm. bf Western blot analysis of LC3B2, ATG5, ATG7and p62 after 48 h of TMAO treatment, n = 3. g-i Western blot analysis of LC3B2 and p62 in H9c2 cells pretreated with 3-MA (5 mM) for 1 h, then exposed to TMAO(1 mM) for another 48 h, n = 3. j, k Representative images of autophagosomes detected by transmission electron microscopy in H9c2 cells pretreated with 3-MA (5 mM) for 1 h, then exposed to TMAO(1 mM) for another 48 h. red arrow: autolysosome; yellow arrow: autophagosome. ln Representative images of fluorescence detection of H9c2 cells transfected with a mCherry-EGFP-LC3 reporter, followed by treatment with 1 mM TMAO for 48 h, scale bar is 20 μm, *P < 0.05, **P < 0.01. ou Western blot analysis (n = 3) of SERCA2a, ANP, and MYH7 and representative microscopic images of cells with rhodamine-phalloidin staining of the cytoskeleton and DAPI staining of the nucleus and cell surface area analysis (n = 4) in H9c2 cells were pretreated with 3MA (5 mM) for 1 h, followed by treatment with TMAO (1 mM) for another 48 h, scale bar is 40 μm. Statistical analyse was performed using the One-way ANOVA with Tukey’s multiple comparisons test. Error bars represent S.E.M.
Fig. 6
Fig. 6. SERCA2a associates with autophagy protein ATG5.
a-b H9c2 cells transfected with Flag-SERCA2a were cultured in the presence or absence of TMAO (1 mM) for 48 h. Representative images of immunofluorescence detection of ATG5 (red) and SERCA2a (green) in the presence or absence of TMAO. Western blot analysis of ATG5, SERCA2a, LC3, ATG7 and p62 after 48 h of TMAO treatment. ce Western blot analysis of ATG5 to examine knockdown efficacy. Immunoprecipitation with anti-Flag antibody was performed, n = 3. fm Western blot analysis (n = 3) of SERCA2a, ANP, and MYH7 and representative microscopic images of cells with rhodamine-phalloidin staining of the cytoskeleton and DAPI staining of the nucleus and cell surface area analysis (n = 4) in H9c2 transfected with control or ATG5 siRNA(100 nM), followed by treatment with TMAO (1 mM) for another 48 h. Scale bar is 40 μm.Two loading controls and target protein have been run on separate gels, and we have indicated it in the supplementary information. Statistical analyse was performed using the One-way ANOVA with Tukey’s multiple comparisons test. Error bars represent S.E.M.
Fig. 7
Fig. 7. SERCA2a undergoes autophagy degradation during TMAO-induced cardiac hypertrophy in mice.
C57BL/6 J were fed with TMAO or vehicle, and then injected intraperitoneally with 3MA for 2 weeks before being sacrificed. a Representative M-mode echocardiography of the left ventricle. Measurement of EF% and FS% (b, c), n = 4. df Representative images of heart size photographed with a stereomicroscope and HW/BW and HW/TL ratios, n = 8. g Cardiac tissue size and fibrosis were detected by FITC-labeled WGA staining (60×), HE staining (40×), and Masson staining (20×). h Representative images of autophagosomes detected by transmission electron microscopy in the heart tissues. Red arrow: autolysosome; yellow arrow: autophagosome. ip Western blot analysis (n = 6) of LC3II, p62, ATG5, SERCA2a, MYH7, and ANP in the left ventricle tissues. Statistical analyse was performed using the One-way ANOVA with Tukey’s multiple comparisons test. Error bars represent S.E.M.
Fig. 8
Fig. 8. Regulation of TMAO-induced cardiac hypertrophy.
TMAO promotes SERCA2a interacts with ATG5 complex (ATG12-ATG5-ATG16L1) and activates autophagy, resulting in the autophagy degradation of SERCA2a and elevated cytoplasmic calcium, which finally causes cardiac hypertrophy.

Similar articles

Cited by

References

    1. Koeth, R. A. et al. Intestinal microbiota metabolism of L-carnitine, a nutrient in red meat, promotes atherosclerosis. Nat. Med.19, 576–585 (2013). - PMC - PubMed
    1. Zhu, W. et al. Gut microbial metabolite TMAO enhances platelet hyperreactivity and thrombosis risk. Cell165, 111–124 (2016). - PMC - PubMed
    1. Wang, Z. et al. Non-lethal inhibition of gut microbial trimethylamine production for the treatment of atherosclerosis. Cell163, 1585–1595 (2015). - PMC - PubMed
    1. Jama, H. A., Beale, A., Shihata, W. A. & Marques, F. Z. The effect of diet on hypertensive pathology: is there a link via gut microbiota-driven immunometabolism? Cardiovascular research 115, 1435-1447, 10.1093/cvr/cvz091 (2019). - PubMed
    1. Naqvi, S. et al. A cross-talk between gut microbiome, salt and hypertension. Biomedicine Pharmacother. = Biomedecine pharmacotherapie134, (2021). 111156. - PubMed

MeSH terms

LinkOut - more resources