

Single-cell RNA sequencing reveals important role of monocytes and macrophages during mucopolysaccharidosis treatment
- PMID: 40210734
- PMCID: PMC11986106
- DOI: 10.1038/s41598-025-97330-7
Single-cell RNA sequencing reveals important role of monocytes and macrophages during mucopolysaccharidosis treatment
Abstract
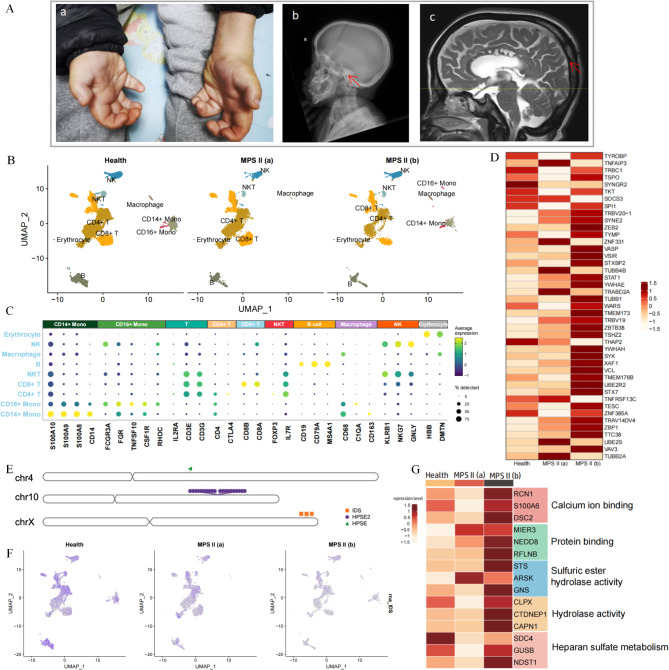
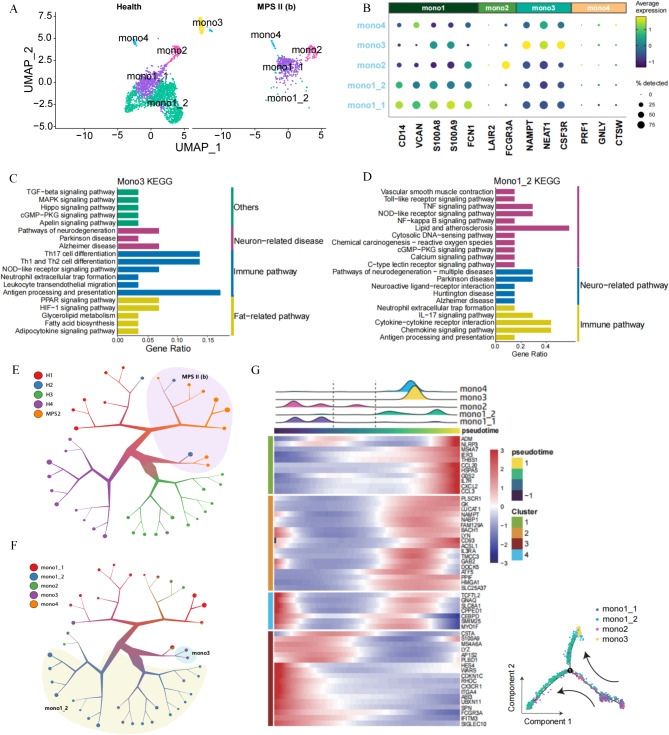
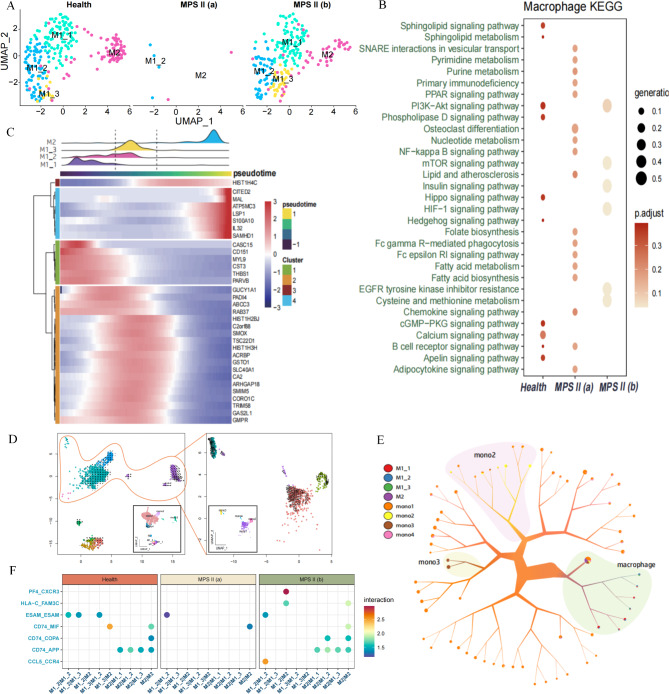
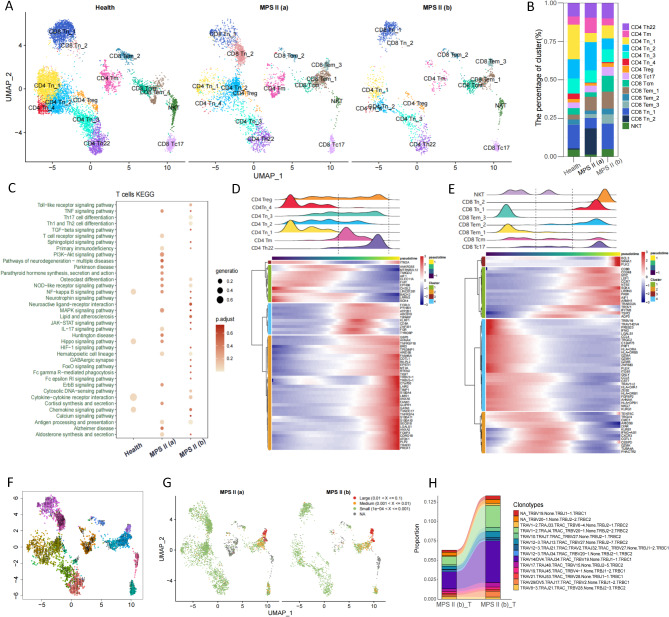
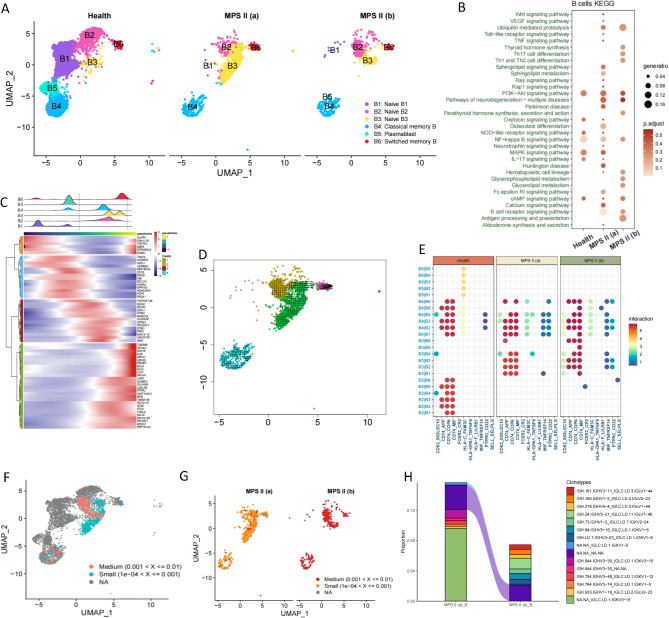
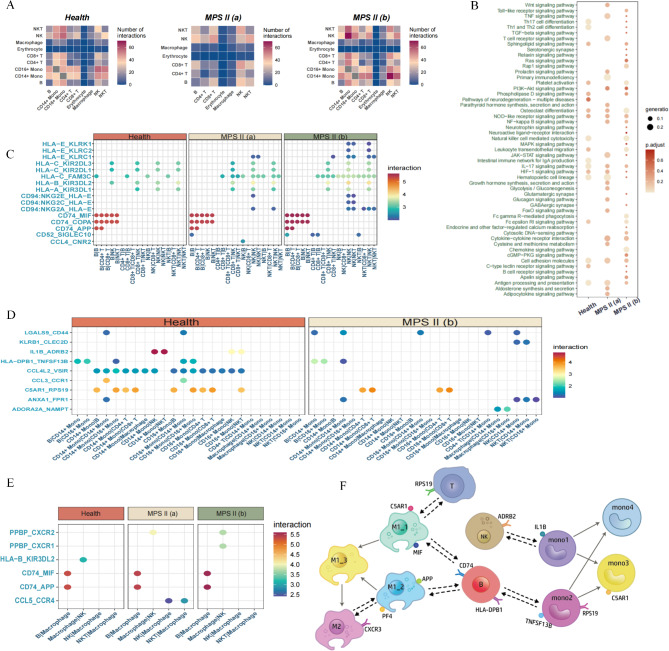
Mucopolysaccharidosis (MPS) encompasses a heterogeneous group of lysosomal storage diseases resulting from mutations in genes encoding lysosomal enzymes responsible for the degradation of mucopolysaccharides, also known as glycosaminoglycans (GAGs). Current therapeutic strategies for MPS include hematopoietic stem cell transplantation (HSCT), enzyme replacement therapy (ERT), and symptomatic therapy. This study investigated dynamic changes in MPS type II (MPS-II) through genomic and single-cell sequencing in a patient undergoing ERT. Analysis of peripheral blood mononuclear cells (PBMCs) from one MPS-II patient of 10 year old at different disease stages through scRNA-seq identified various immune cell types, including natural killer (NK) cells, NKT cells, CD4 + and CD8 + T cells, CD14 + and CD16 + monocytes, and B cells. Monocytes and macrophages were significantly reduced during the severe stage of MPS-II but increased during the recovery stage following ERT. Notably, monocyte subtype mono3 was exclusively expressed in the severe stage, while mono1_2, a subtype of mono1, was absent during the severe stage and exhibited distinct biological functions. These findings suggest that monocytes and macrophages play critical roles in the pathogenesis of MPS-II and in the response to ERT. Pseudotime, Gene Ontology, and cell-communication analyses revealed unique functions for the different cellular subtypes. Notably, key molecules mediating cellular interactions during ERT in MPS-II included CXCR3, PF4, APP, and C5AR1 in macrophages, RPS19 in T cells, HLA-DPB1 in B cells, ADRB2 in NK cells, and IL1B, C5AR1, RPS19, and TNFSF13B in monocytes. Overall, integrative analysis delineated the expression dynamics of various cell types and identified mutations in MPS-II, providing a comprehensive atlas of transcriptional programs, cellular characterizations, and genomic variation profiles in MPS-II. This dataset, along with advanced integrative analysis, represents a valuable resource for the discovery of drug targets and the improvement of therapeutic strategies for MPS-II.
Keywords: Enzyme replacement therapy; Single-cell RNA sequencing; T-cell receptor sequencing; Type II mucopolysaccharidosis; Whole-genome sequencing.
© 2025. The Author(s).
Conflict of interest statement
Declarations. Competing interests: The authors declare no competing interests. Ethics approval and consent to participate: All procedures involving human subjects and tissues were approved by Institutional Review Board of Children’s Hospital of Chongqing Medical University (NO.20230604) in accordance with the Declaration of Helsinki and International Ethical Guidelines for Biomedical Research Involving Human Subjects. Written informed consent was obtained from guardian participants.
Figures
Similar articles
-
Mucopolysaccharidoses I and II: Brief Review of Therapeutic Options and Supportive/Palliative Therapies.Biomed Res Int. 2020 Dec 4;2020:2408402. doi: 10.1155/2020/2408402. eCollection 2020. Biomed Res Int. 2020. PMID: 33344633 Free PMC article. Review.
-
Enzyme replacement therapy (ERT) procedure for mucopolysaccharidosis type II (MPS II) by intraventricular administration (IVA) in murine MPS II.Mol Genet Metab. 2012 Sep;107(1-2):122-8. doi: 10.1016/j.ymgme.2012.05.005. Epub 2012 May 18. Mol Genet Metab. 2012. PMID: 22704483
-
Therapeutic Options for Mucopolysaccharidosis II (Hunter Disease).Curr Pharm Des. 2020;26(40):5100-5109. doi: 10.2174/1381612826666200724161504. Curr Pharm Des. 2020. PMID: 33138761 Review.
-
Treatment reduces or stabilizes brain imaging abnormalities in patients with MPS I and II.Mol Genet Metab. 2009 Dec;98(4):406-11. doi: 10.1016/j.ymgme.2009.07.015. Epub 2009 Aug 5. Mol Genet Metab. 2009. PMID: 19748810
-
Hematopoietic Stem Cell Transplantation for Patients with Mucopolysaccharidosis II.Biol Blood Marrow Transplant. 2017 Oct;23(10):1795-1803. doi: 10.1016/j.bbmt.2017.06.020. Epub 2017 Jul 1. Biol Blood Marrow Transplant. 2017. PMID: 28673849 Free PMC article.
References
-
- Ganesh, A., Bruwer, Z. & Al-Thihli, K. An update on ocular involvement in mucopolysaccharidoses. Curr. Opin. Ophthalmol.24(5), 379–388. 10.1097/ICU.0b013e3283644ea1 (2013). - PubMed
-
- Yogalingam, G. & Hopwood, J. J. Molecular genetics of mucopolysaccharidosis type IIIA and IIIB: Diagnostic, clinical, and biological implications. Hum. Mutat.18(4), 264–281. 10.1002/humu.1189 (2001). - PubMed
-
- Wiśniewska, K., Wolski, J., Gafke, L., Cyske, Z. & Pierzynowska, K. Węgrzyn. Misdiagnosis in mucopolysaccharidoses. J. Appl. Genet.63, 475–495. 10.1007/s13353-022-00703-1 (2022). - PubMed
MeSH terms
Grants and funding
LinkOut - more resources
Full Text Sources
Research Materials
Miscellaneous
