. 2025 Apr 10;16(1):3408.
doi: 10.1038/s41467-025-58714-5.

The Spatial Transcriptional Activity of Hepatic TCF7L2 Regulates Zonated Metabolic Pathways that Contribute to Liver Fibrosis

Affiliations

The Spatial Transcriptional Activity of Hepatic TCF7L2 Regulates Zonated Metabolic Pathways that Contribute to Liver Fibrosis

Iriscilla Ayala et al. Nat Commun. .

Abstract

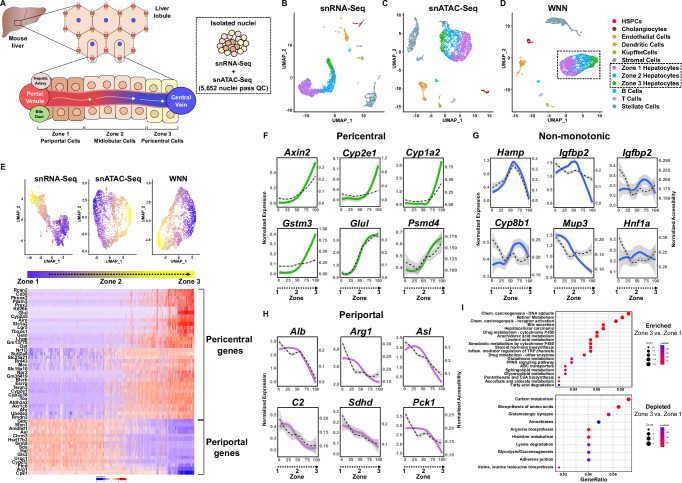
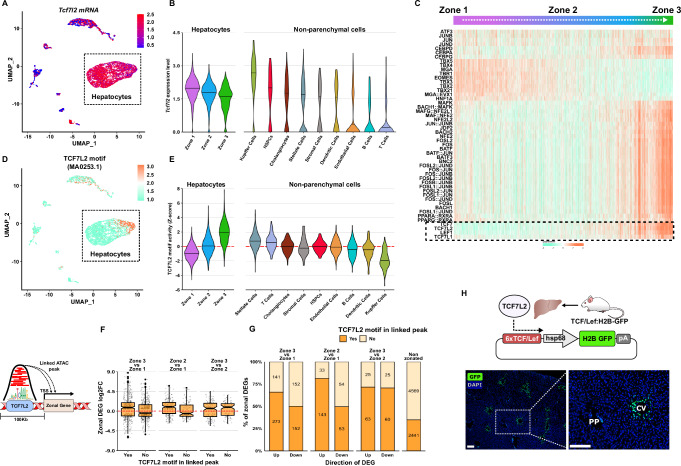
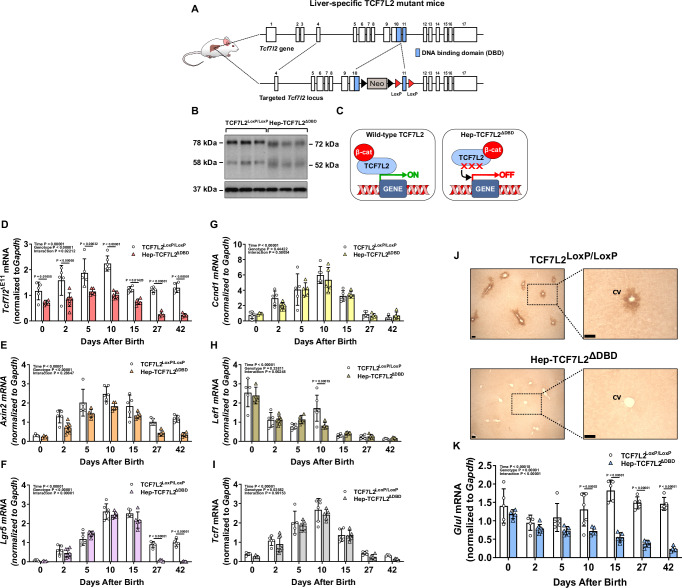
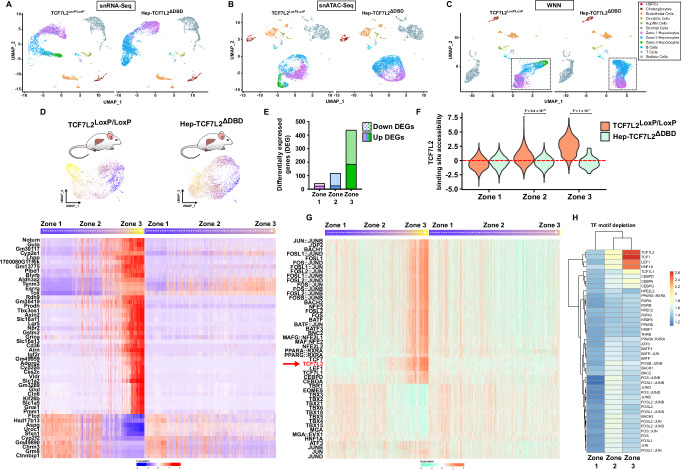
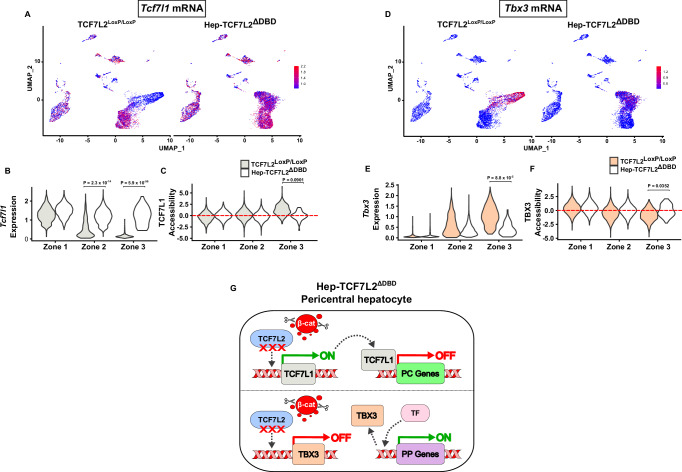
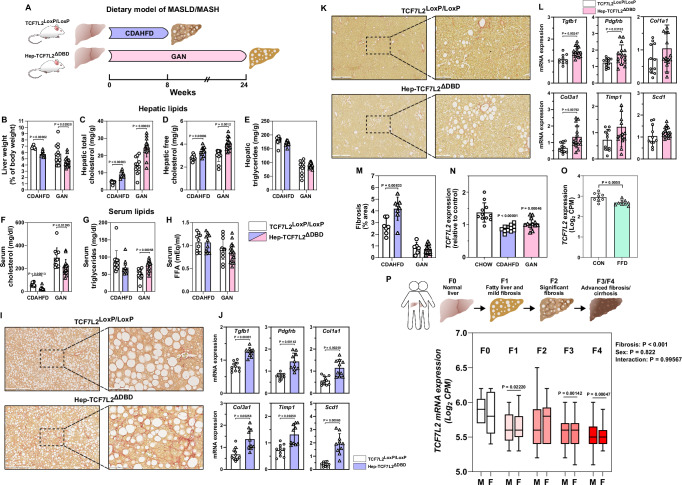
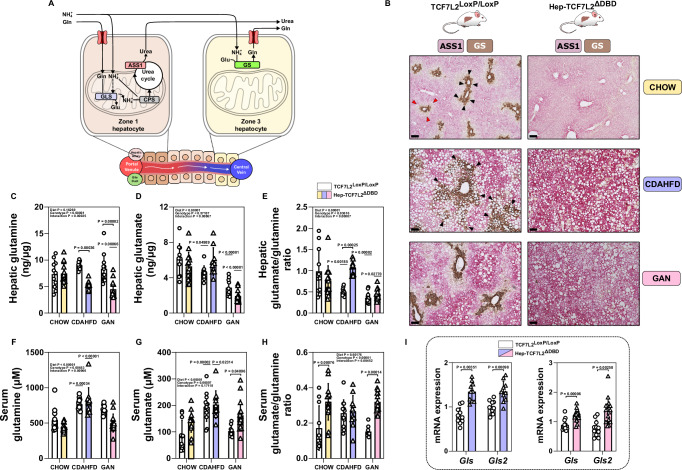
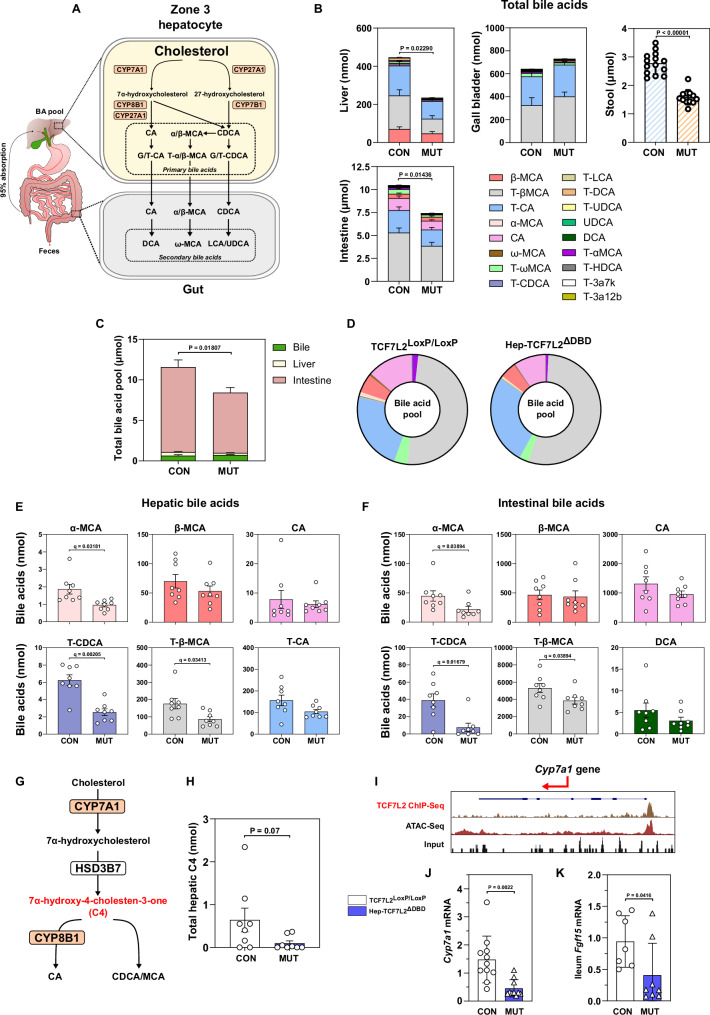
The molecular mechanisms regulating the zonal distribution of metabolism in liver are incompletely understood. Here we use single nuclei genomics techniques to examine the spatial transcriptional function of transcription factor 7-like 2 (TCF7L2) in mouse liver, and determine the consequences of TCF7L2 transcriptional inactivation on the metabolic architecture of the liver and the function of zonated metabolic pathways. We report that while Tcf7l2 mRNA expression is ubiquitous across the liver lobule, accessibility of the consensus TCF/LEF DNA binding motif is restricted to pericentral (PC) hepatocytes in zone 3. In mice expressing functionally inactive TCF7L2 in liver, PC hepatocyte-specific gene expression is absent, which we demonstrate promotes hepatic cholesterol accumulation, impaired bile acid synthesis, disruption to glutamine/glutamate homeostasis and pronounced dietary-induced hepatic fibrosis. In summary, TCF7L2 is a key regulator of hepatic zonal gene expression and regulates several zonated metabolic pathways that may contribute to the development of fibrotic liver disease.


Conflict of interest statement

Competing interests: The authors declare no competing interests.

Figures

Fig. 1
Fig. 1. Single nuclei multiomics identifies zonated hepatocyte nuclei.
A Nuclei were extracted from samples of frozen mouse liver isolated from control mice (TCF7L2LoxP/LoxP, n = 3) and processed through the 10X Chromium Single Cell Multiome ATAC and Gene Expression pipeline. After QC and filtering, 5,652 nuclei were used for clustering analysis. B The RNA data of all samples was integrated using the reciprocal PCA approach via Seurat. C ATAC data were integrated using the reciprocal LSI approach via Signac, and (D) the Weighted Nearest Neighbor (WNN) approach was used for the integrative analysis of the two modalities. Each modality and the integrative analysis detected the major parenchymal and non-parenchymal cell populations in mouse liver. Hepatocyte nuclei were subdivided into periportal (PP) zone 1, mid-lobular zone 2, and pericentral (PC) zone 3 hepatocytes based on the expression of zonated marker genes, as detailed in the methodology. E Trajectory analysis was performed on hepatocyte nuclei only using Monocle3. The component of WNN hepatocyte-only clustering that was enriched for zone 1 PP marker gene expression was designated as the root node. We considered a gene zonally expressed if it was identified as a differentially expressed gene (DEGs) and was associated with the hepatocyte trajectory. F–H The expression (solid colored line) and accessibility (dashed line) of landmark zonated genes identified by Halpern et al.. in C57BL/6 mice was examined in our control liver dataset. Shown is the average with the spread (shaded region) representing the SEM. I Pathway analysis revealed enrichment of classically zonated metabolic pathways in TCF7L2LoxP/LoxP livers, including bile secretion, cholesterol metabolism, and xenobiotic metabolism. Source data are provided as a Source Data file. Single nuclei data are available for download at GEO (accession: GSE239480).
Fig. 2
Fig. 2. The transcriptional activity of TCF7L2 is zonally restricted in mouse liver.
A, B The mRNA expression of Tcf7l2 is found in hepatocytes and several non-parenchymal cell populations, including Kupffer cells, hematopoietic stem and progenitor cells (HSPCs), and stellate cells. However, Tcf7l2 expression is not zonated and is found in nuclei isolated from hepatocytes across the liver lobule. C We detected 102 zonally enriched DNA binding motifs in our ATAC-Seq data, 50 of which are shown in this figure. These include highly similar motifs that are shared by transcription factors of the same family. Ordering hepatocyte nuclei by pseudotime highlights clear zonal preferences for the accessibility of several transcription factor motifs. D, E In our ATAC-Seq data, the accessibility of the conserved DNA binding motif for TCF7L2 (MA0253.1) was restricted to nuclei isolated from zone 3 hepatocytes and was largely inaccessible in non-parenchymal cell populations. F, G The presence of the TCF7L2 binding motif is enriched in linked ATAC-Seq peaks within 100 kb of the transcription start site (TSS) of zone 2 and 3 DEGs (FDR < 0.05), compared to non-zonated genes. In the plot, the lower and upper hinges correspond to the 25th and 75th percentiles, and the whiskers extend to ± 1.5 times the interquartile range (IQR) from each hinge. The notches extend 1.58*IQR / sqrt(n), which gives a roughly 95% confidence interval for comparing medians. Each small dot (gray) is an individual differentially expressed gene (DEG), and the large circles are those DEGs outside ± 1.5 times IQR. These data were derived from 3 independent TCF7L2LoxP/LoxP mouse livers. H In liver tissue isolated from TCF/LEF reporter mice, Wnt signaling pathway activity was restricted to zone 3 hepatocytes around the central vein (CV) and was not detected in zone 2 or periportal (PP) zone 3. The image shown is a representative image from five independent replicate experiments. Scale bar = 100 µm. Source data are provided as a Source Data file. Single nuclei data are available for download at GEO (accession: GSE239480).
Fig. 3
Fig. 3. Removing the DNA binding domain of TCF7L2 inhibits Wnt signaling and glutamine synthetase expression.
A To excise the DNA binding domain (DBD) of TCF7L2, specifically in the liver, LoxP sites were placed either side of exon 11, and mice homozygous for this allele were bred with Alb-Cre mice. B, C In overnight fasted 32-week-old Hep-TCF7L2ΔDBD mice, a smaller TCF7L2 protein is expressed corresponding to the excision of the DBD. The Western blot image in (B) is representative of four independent experiments on at least three liver samples harvested from both control and Hep-TCF7L2ΔDBD mice. D Tcf7l2 transcripts containing exon 11 are significantly reduced in six-week-old (42-day) mice. E, F The expression of Axin2 and Lgr5, a direct TCF7L2 transcriptional target, are similarly reduced in 6-week-old Hep-TCF7L2ΔDBD mice. G–I The expression of Ccnd1, Lef1, and Tcf7 are not different in the livers of TCF7L2 mutant mice. J In control mice, glutamine synthetase (GS) protein was found exclusively around the central vein (CV) in the liver, but GS protein was not detectable in Hep-TCF7L2ΔDBD mice. K The mRNA expression of glutamine synthetase (Glul) also was undetectable in 6-week-old Hep-TCF7L2ΔDBD mice. Sample sizes for (D–I and K): Day 0 TCF7L2LoxP/LoxP n = 5, Hep-TCF7L2ΔDBD n = 4; Day 2 TCF7L2LoxP/LoxP n = 5, Hep-TCF7L2ΔDBD n = 8; Day 5 TCF7L2LoxP/LoxP n = 5, Hep-TCF7L2ΔDBD n = 5; Day 10 TCF7L2LoxP/LoxP n = 6, Hep-TCF7L2ΔDBD n = 5; Day 15 TCF7L2LoxP/LoxP n = 6, Hep-TCF7L2ΔDBD n = 5; Day 27 TCF7L2LoxP/LoxP n = 6, Hep-TCF7L2ΔDBD n = 5; Day 42 TCF7L2LoxP/LoxP n = 6, Hep-TCF7L2ΔDBD n = 5. Data were analyzed using a two-way ANOVA and Holm-Sidak multiple comparison tests, and are presented as mean values +/− SD. Source data are provided as a Source Data file.
Fig. 4
Fig. 4. Transcriptional inactivation of TCF7L2 eliminates zone 3 gene expression.
Multiomics analysis was performed on nuclei isolated from the livers of TCF7L2LoxP/LoxP (n = 3) and Hep-TCF7L2ΔDBD (n = 3) mice. A Single nuclei RNA-Seq (snRNA-Seq), (B) single nuclei ATAC-Seq (snATAC-Seq), and (C) integrated weighted nearest neighbor (WNN) are shown. In Hep-TCF7L2ΔDBD mice, nuclei corresponding to zone 3 were largely absent and instead clustered with zone 2 nuclei. D Heatmap of gene expression following trajectory analysis reveals the clear absence of zone 3 gene expression in Hep-TCF7L2ΔDBD. The color gradient above the heatmap is for visual purposes only. E Differential expression analysis confirms that the loss of TCF7L2 transcription had minimal impact on zone 1 and 2 genes, but significantly impacted the expression of genes in zone 3 nuclei. For this DEG analysis, TCF7L2 mutant zone 3 nuclei were identified based on their clustering relative to zone 3 nuclei in the control mice. F In snATAC-Seq analysis, accessibility of the TCF7L2 binding motif was disrupted in zone 3 nuclei isolated from Hep-TCF7L2ΔDBD mice. Mutant zones 2 and 3 nuclei were combined for statistical comparison with respective control nuclei, as detailed in the text. G TCF7L2 loss of function alters the motif accessibility of several transcription factors that may contribute to the maintenance of metabolic zonation. Heatmap of chromVAR regression scores of motifs that were associated with the hepatocyte trajectory and displayed significant differences in accessibility between zones. H Analysis of snATAC-Seq data using Signac highlights the reduction of transcription factor (TF) motif accessibility in zones 2 and zones 3. A heatmap of fold enrichment for motif binding sites within sets of differentially less accessible chromatin regions between TCF7L2 and control nuclei in each hepatocyte zone. Source data are provided as a Source Data file. Single nuclei data are available for download at GEO (accession: GSE239480).
Fig. 5
Fig. 5. TBX3 and TCF7L1 cooperate with TCF7L2 to regulate zonal gene expression.
A, B snRNA-Seq demonstrates that the expression of Tcf7l1 is found primarily in zone 1 nuclei isolated from TCF7L2LoxP/LoxP mice, but is significantly enhanced in zone 2 and zone 3 nuclei in Hep-TCF7L2ΔDBD mice. C Conversely, the accessibility of the TCF7L1 motif is reduced in zone 3 nuclei isolated from Hep-TCF7L2ΔDBD mice. D and E The expression of Tbx3 is highest in zone 3 nuclei in TCF7L2LoxP/LoxP mice, which is ameliorated in Hep-TCF7L2ΔDBD mice. F The accessibility of the TBX3 binding motif is elevated in zone 3 nuclei isolated from TCF7L2 mutant livers. Default DESeq2 statistical testing methodology was used (Wald test) with Benjamin and Hochberg multiple comparison correction. Mutant zones 2 and 3 nuclei were combined for statistical comparison with respective control nuclei, as detailed in the text. G Summary of the proposed role of TBX3 and TCF7L2 in PC hepatocytes lacking TCF7L2. The release of TCF7L2 from the DNA enhances TCF7L1 expression and activity, which suppresses the expression of pericentral (PC) hepatocyte genes. Conversely, TBX3 expression and chromatin occupancy is reduced, allowing other transcription factors (TF) to access this site and activate the expression of periportal (PP) genes. Single nuclei data are available for download at GEO (accession: GSE239480).
Fig. 6
Fig. 6. Hep-TCF7L2ΔDBD mice are susceptible to dietary-induced hepatic fibrosis.
A Schematic outlining the two dietary models of MASLD and MASH. Mice were placed on the choline-deficient, L-amino acid-defined, high-fat diet (CDAHFD) or the Gubra-Amylin NASH (GAN) diet for 8- and 24 weeks, respectively. B Liver weights were significantly lower in Hep-TCF7L2ΔDBD mice following both diets (CDAHFD diet: TCF7L2LoxP/LoxP n = 6, Hep-TCF7L2ΔDBD n = 11; GAN diet: TCF7L2LoxP/LoxP n = 12, Hep-TCF7L2ΔDBD n = 15). C Total and (D) free hepatic cholesterol was elevated in Hep-TCF7L2ΔDBD mice, but there were no differences in hepatic triglycerides (E). Amongst serum lipids, cholesterol (F) was consistently lower in Hep-TCF7L2ΔDBD mice fed either diet (sample sizes for C–F: CDAHFD: TCF7L2LoxP/LoxP n = 11, Hep-TCF7L2ΔDBD n = 10; GAN: TCF7L2LoxP/LoxP n = 12, Hep-TCF7L2ΔDBD n = 15). Triglycerides (G) were elevated in mutant mice fed the GAN diet (CDAHFD: TCF7L2LoxP/LoxP n = 13, Hep-TCF7L2ΔDBD n = 11; GAN: TCF7L2LoxP/LoxP n = 12, Hep-TCF7L2ΔDBD n = 15), but no changes in free fatty acids (FFA) (H) were detected (CDAHFD: TCF7L2LoxP/LoxP n = 11, Hep-TCF7L2ΔDBD n = 11; GAN: TCF7L2LoxP/LoxP n = 13, Hep-TCF7L2ΔDBD n = 15). I Hepatic fibrosis in mice fed the CDAHFD was examined using Sirius Red staining and was elevated in Hep-TCF7L2ΔDBD mice (quantitated in M). J The expression of genes involved in fibrogenesis and inflammation was elevated in Hep-TCF7L2ΔDBD mice fed the CDAHFD diet (TCF7L2LoxP/LoxP n = 12, Hep-TCF7L2ΔDBD n = 15). K Hepatic fibrosis in mice fed the GAN diet was examined using Sirius Red staining and was not different between control and Hep-TCF7L2ΔDBD mice (quantitated in M). L However, the expression of genes involved in fibrogenesis and inflammation was also elevated in Hep-TCF7L2ΔDBD mice fed the GAN diet (TCF7L2LoxP/LoxP n = 12, Hep-TCF7L2ΔDBD n = 15). N The expression of hepatic Tcf7l2 is reduced in mice fed the CDAHFD and GAN diet (CHOW n = 11, CDAHFD n = 11, GAN n = 12), and (O) in mice fed a fast-food diet (FFD) for 11 months CON n = 8, FFD n = 9). This diet consisted of a commercially available high-fat, high-cholesterol diet (Research Diets Inc, D12079B) and drinking water containing 23.1 g fructose and 17.2 g glucose per 1000 mL of water. P In deidentified and anonymized data obtained from the analysis of human liver biopsies, TCF7L2 expression is progressively reduced as fibrosis severity increases, an effect not modified by male (M) or female (F) sex (F0: males n = 5, females n = 5; F1: males n = 10, females n = 13; F2 males n = 11, females n = 10; F3: males n = 27; females n = 26; F4: males n = 21, females n = 19). In the plot, the box extends from the 25th to the 75th percentile, and the line across the box represents the median value. Whiskers extend to minimum and maximum values. Data are presented as mean values +/− SD and were analyzed using unpaired two-sided Welch t tests with (panels BH, J, and M) or without (panel O) Holm-Sidak correction for multiple comparisons or one-way ANOVA with Holm-Sidak correction for multiple comparisons (panel N). Human biopsy data (panel P) were analyzed using a two-way ANOVA with Holm-Sidak multiple comparison correction. Source data are provided as a Source Data file.
Fig. 7
Fig. 7. Zonated pathways linked to ammonia detoxification are disrupted in Hep-TCF7L2ΔDBD mice.
A The two primary pathways of ammonia [NH4]+ detoxification in the liver are urea and glutamine synthesis. Urea synthesis in zone 1 PP hepatocytes is a system of low affinity for ammonia detoxification. The glutaminase (GLS) enzyme is stimulated by [NH4]+ and regulates the flow of nitrogen derived from glutamine through the urea cycle. In zone 3 PC hepatocytes, glutamine synthetase (GS) uses [NH4]+ and glutamate to synthesize glutamine and, thus, acts as a high-affinity scavenger for [NH4]+ that escapes zone 1 detoxification. B In mouse liver, we used staining of argininosuccinate synthase 1 (ASS1) and GS to distinguish zones 1 and 2 from zone 3. In chow-fed TCF7L2LoxP/LoxP mice, ASS1 was not observed in zone 3 hepatocytes (top panel, red arrowheads), whereas GS staining was found in only a few layers of hepatocytes around the central vein (CV) (top panel, black arrowheads). Following the GAN diet, GS staining was more diffuse and expanded into mid-lobular zone 2 hepatocytes (middle panel, black arrowheads). In TCF7L2 mutant livers, GS staining is completely absent, and centrilobular ASS1 staining is observed. Scale bar = 100 µm. C Hepatic glutamine levels were unchanged in chow-fed Hep-TCF7L2ΔDBD mice but were significantly reduced following the CDAHFD (blue bars) and GAN (pink bars) diets. D Glutamate concentrations in the liver were reduced following both diets in control mice, but remained elevated in Hep-TCF7L2ΔDBD mice fed the CDAHFD. E An elevated hepatic glutamate:glutamine ratio was observed in TCF7L2 mutant mice fed the CDAHFD, indicative of glutaminolysis (sample sizes for panels CE: CHOW TCF7L2LoxP/LoxP n = 11, CDAHFD TCF7L2LoxP/LoxP n = 11, GAN TCF7L2LoxP/LoxP n = 12; CHOW Hep-TCF7L2ΔDBD n = 15, CDAHFD Hep-TCF7L2ΔDBD n = 10, GAN Hep-TCF7L2ΔDBD n = 15). F, G Serum glutamine and glutamate concentrations were augmented following the CDAHFD, and a significant increase in the circulating glutamate:glutamine ratio (H) was observed in chow and GAN diet-fed mice, but not in CDAHFD fed mice (sample sizes for panel FH: CHOW TCF7L2LoxP/LoxP n = 11, CDAHFD TCF7L2LoxP/LoxP n = 13, GAN TCF7L2LoxP/LoxP n = 10; CHOW Hep-TCF7L2ΔDBD n = 14, CDAHFD Hep-TCF7L2ΔDBD n = 11, GAN Hep-TCF7L2ΔDBD n = 15. I The mRNA expression of Gls and glutaminase 2 (Gls2) was increased in TCF7L2 mutant mice fed both diets (CDAHFD: TCF7L2LoxP/LoxP n = 11, Hep-TCF7L2ΔDBD n = 10; GAN: TCF7L2LoxP/LoxP n = 11, Hep-TCF7L2ΔDBD n = 16). Data are presented as mean values +/−SD and were analyzed using a two-way ANOVA (panels CH) or Welch t tests (panel I), with Holm-Sidak correction for multiple comparisons. Source data are provided as a Source Data file.
Fig. 8
Fig. 8. Hepatic bile acid synthesis is impaired in Hep-TCF7L2ΔDBD mice.
A Primary bile acids (i.e., cholic acid) are synthesized from cholesterol in zone 3 PC hepatocytes, following which they are secreted into the lumen of the intestine and modified by gut bacteria to produce secondary bile acids (i.e., deoxycholic acid). B, C In Hep-TCF7L2ΔDBD mice fed the CDAHFD, both hepatic and intestinal bile acids were significantly reduced. In a separate cohort of mice, stool bile acids were similarly lower in Hep-TCF7L2ΔDBD mice fed the CDAHFD. However, the composition of the bile acid pool (D) was not different between the two groups of mice. Example of hepatic (E) and intestinal (F) conjugated and unconjugated bile acid that were significantly reduced in Hep-TCF7L2ΔDBD mice. G The cholesterol 7 alpha-hydroxylase (CYP7A1) enzyme is the rate-controlling step in the synthesis of bile acids from cholesterol in the liver, and its activity can be monitored through the quantitation of the intermediate metabolite 7α-hydroxy-4- cholesten-3-one (C4). H Total hepatic C4 was reduced in TCF7L2 mutant mice (sample sizes for panels BH: TCF7L2LoxP/LoxP n = 8, Hep-TCF7L2ΔDBD n = 8). I A TCF7L2 ChIP-Seq peak is observed in the proximal promoter of the mouse Cyp7a1 gene and overlaps a region of open chromatin. J The mRNA expression of hepatic Cyp7a1 was significantly reduced in Hep-TCF7L2ΔDBD mice (TCF7L2LoxP/LoxP n = 11, In Hep-TCF7L2ΔDBD n = 10). K The expression of ileal Fgf15 mRNA was reduced in Hep-TCF7L2ΔDBD mice, suggesting that feedback inhibition by elevated circulating FGF15 cannot explain the downregulation of Cyp7a1 in Hep-TCF7L2ΔDBD mice (TCF7L2LoxP/LoxP n = 7, In Hep-TCF7L2ΔDBD n = 8). Data are presented as mean values +/− SD and were analyzed using two-sided unpaired Welch t tests. To correct for multiple comparisons in bile acids analysis (panels E and F), a false discovery (FDR) approach was used with a q-value ≤ 0.05 considered significant. Source data are provided as a Source Data file. Mass spec data are available for download at Metabolomics Workbench (accession: ST003641).

Similar articles

Cited by

References

    1. Asrani, S. K. et al. Burden of liver diseases in the world. J. Hepatol.70, 151–171 (2019). - PubMed
    1. Rinella, M. E. et al. A multi-society Delphi consensus statement on new fatty liver disease nomenclature. J. Hepatol. 78, 1966–1986 2023. - PubMed
    1. Harrison, S. A. et al. Prospective evaluation of the prevalence of non-alcoholic fatty liver disease and steatohepatitis in a large middle-aged US cohort. J. Hepatol. 75, 284–291 2021. - PubMed
    1. Collaborators, G.B.D.C. The global, regional, and national burden of cirrhosis by cause in 195 countries and territories, 1990-2017: a systematic analysis for the Global Burden of Disease Study 2017. Lancet Gastroenterol. Hepatol.5, 245–266 (2020). - PMC - PubMed
    1. Gebhardt, R. Metabolic zonation of the liver: regulation and implications for liver function. Pharm. Ther.53, 275–354 (1992). - PubMed

Substances

LinkOut - more resources