. 2025 Apr 10;16(1):3418.
doi: 10.1038/s41467-025-58609-5.

The overlapping global distribution of dengue, chikungunya, Zika and yellow fever

Affiliations

The overlapping global distribution of dengue, chikungunya, Zika and yellow fever

Ahyoung Lim et al. Nat Commun. .

Abstract

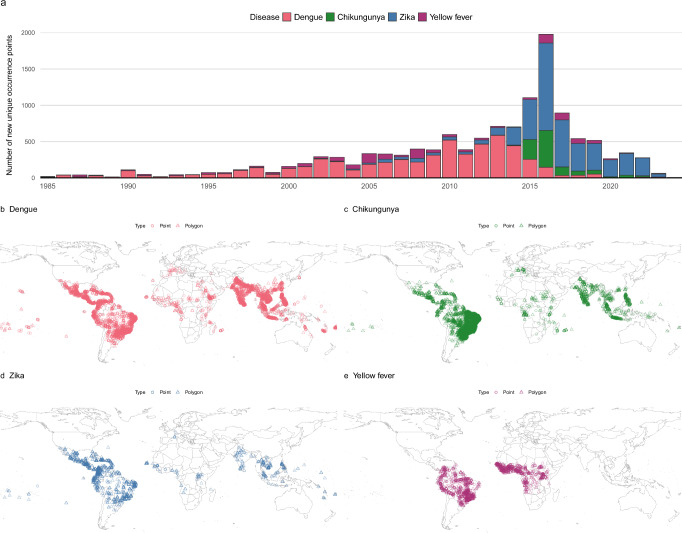
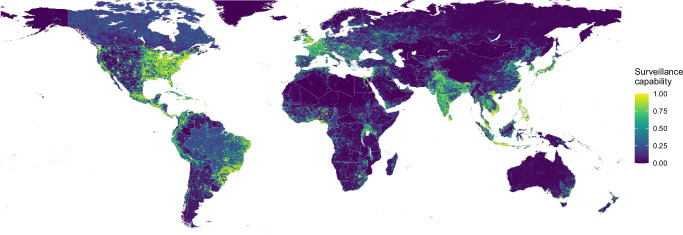
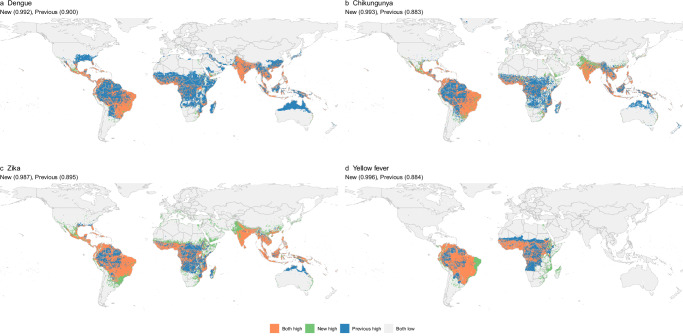
Arboviruses transmitted mainly by Aedes (Stegomyia) aegypti and Ae. albopictus, including dengue, chikungunya, and Zika viruses, and yellow fever virus in urban settings, pose an escalating global threat. Existing risk maps, often hampered by surveillance biases, may underestimate or misrepresent the true distribution of these diseases and do not incorporate epidemiological similarities despite shared vector species. We address this by generating new global environmental suitability maps for Aedes-borne arboviruses using a multi-disease ecological niche model with a nested surveillance model fit to a dataset of over 21,000 occurrence points. This reveals a convergence in suitability around a common global distribution with recent spread of chikungunya and Zika closely aligning with areas suitable for dengue. We estimate that 5.66 (95% confidence interval 5.64-5.68) billion people live in areas suitable for dengue, chikungunya and Zika and 1.54 (1.53-1.54) billion people for yellow fever. We find large national and subnational differences in surveillance capabilities with higher income more accessible areas more likely to detect, diagnose and report viral diseases, which may have led to overestimation of risk in the United States and Europe. When combined with estimates of uncertainty, these suitability maps can be used by ministries of health to target limited surveillance and intervention resources in new strategies against these emerging threats.


Conflict of interest statement

Competing interests: The authors declare no competing interests.

Figures

Fig. 1
Fig. 1. The temporal and spatial distribution of Aedes-borne arbovirus occurrence points.
a The global number of new unique occurrence points added each year (i.e. after thinning). Years with sparse (n < 100) occurrence records (1927–1984) are not shown. be global maps of occurrence data for dengue (b), chikungunya (c), Zika (d) and yellow fever (e). The maps were created using public-domain Natural Earth data, accessed through the rnaturalearth package in R.
Fig. 2
Fig. 2. Model-predicted relative surveillance capability for emerging acute viral infectious diseases.
Values close to 1 (yellow) indicate that a viral infection is more likely to be publicly reported. The map was created using public-domain Natural Earth data, accessed through the rnaturalearth package in R.
Fig. 3
Fig. 3. Model-predicted environmental suitability for dengue, chikungunya, and Zika, and yellow fever after accounting for spatial variation in surveillance capacity.
Suitability values represent the probability of one or more cases of diseases having occurred up to 2024, based on the average environmental conditions of a location over the period 2010–2020. Values close to 1 indicate highly suitable conditions for transmission. a Areas without a suitable temperature range for transmission have been set to 0 for dengue, chikungunya, and Zika. b Areas outside the countries at risk, endemic, or potentially at risk for yellow fever as defined by the WHO yellow fever risk assessment working group have been set to 0. The maps were created using public-domain Natural Earth data, accessed through the rnaturalearth package in R.
Fig. 4
Fig. 4. Comparison of previously published and current suitability maps for arboviral diseases.
Panels show comparisons between earlier published maps and our newly generated maps for (a) dengue, (b) chikungunya, (c) Zika, and (d) yellow fever. Previous maps were retrieved from Messina et al. for dengue, Nsoesie et al. for chikungunya, Messina et al. for Zika, and Shearer et al. for yellow fever. Area Under the Curve (AUC) values for our map and previous maps are indicated in parentheses. AUC values measure the model’s ability to distinguish between occurrence and background points, with values closer to 1 indicating better predictive performance. The AUC was calculated based on predicted values from both our map and previous maps using presence and background points. Maps were converted into binary format using a threshold that maximised the global sum of sensitivity and specificity. Once binary maps of at-risk areas were generated, we categorised each 5 × 5 km pixel into one of four groups: (1) areas at risk in both our map and the previous maps, (2) areas at risk only in previous maps, (3) areas at risk only in our map, and (4) areas not at risk in either map. The maps were created using public-domain Natural Earth data, accessed through the rnaturalearth package in R.

Similar articles

Cited by

References

    1. GBD 2021 Risk Factors Collaborators. Global burden and strength of evidence for 88 risk factors in 204 countries and 811 subnational locations, 1990-2021: a systematic analysis for the global burden of disease study 2021. Lancet403, 2162–2203 (2024). - PMC - PubMed
    1. World Health Organization. Dengue- Global situation. https://www.who.int/emergencies/disease-outbreak-news/item/2023-DON498 (2023).
    1. Munayco, C. V. et al. Notes from the field: dengue outbreak - Peru, 2023. MMWR Morb. Mortal. Wkly Rep.73, 86–88 (2024). - PMC - PubMed
    1. Mahmud, A. S., Bhattacharjee, J., Baker, R. E. & Martinez, P. P. Alarming trends in dengue incidence and mortality in Bangladesh. J. Infect. Dis.229, 4–6 (2024). - PMC - PubMed
    1. Pan American Health Organization / World Health Organization (PAHO/WHO). dengue epidemiological situation in the region of the Americas - epidemiological week 08, 2024. https://www.paho.org/en/documents/situation-report-no-9-dengue-epidemiol... (2024).

LinkOut - more resources