. 2025 Apr 10;16(1):3410.
doi: 10.1038/s41467-025-58746-x.

Allosteric targeted drug delivery for enhanced blood-brain barrier penetration via mimicking transmembrane domain interactions

Affiliations

Allosteric targeted drug delivery for enhanced blood-brain barrier penetration via mimicking transmembrane domain interactions

Kaicheng Tang et al. Nat Commun. .

Abstract

Current strategies for active targeting in the brain are entirely based on the effective interaction of the ligand with the orthosteric sites of specific receptors on the blood-brain barrier (BBB), which is highly susceptible to various pathophysiological factors and limits the efficacy of drug delivery. Here, we propose an allosteric targeted drug delivery strategy that targets classical BBB transmembrane receptors by designing peptide ligands that specifically bind to their transmembrane domains. This strategy prevents competitive interference from endogenous ligands and antibodies by using the insulin receptor and integrin αv as model targets, respectively, and can effectively overcome pseudotargets or target loss caused by shedding or mutating the extracellular domain of target receptors. Moreover, these ligands can be spontaneously embedded in the phospholipid layer of lipid carriers using a plug-and-play approach without chemical modification, with excellent tunability and immunocompatibility. Overall, this allosteric targeted drug delivery strategy can be applied to multiple receptor targets and drug carriers and offers promising therapeutic benefits in brain diseases.


Conflict of interest statement

Competing interests: The authors declare no competing interests.

Figures

Fig. 1
Fig. 1. Schematic illustration of the allosteric targeting strategy and its application for Alzheimer disease.
a Challenges to orthosteric targeting based on recognition of the ectodomain of membrane proteins, including endogenous ligands or antibodies competitively binding to ectodomain, pseudo-targets caused by shedding of the ectodomain, and target loss due to mutations in the ectodomain. b Lipid carriers (e.g., liposomes, lipid nanoparticles, or exosomes) are modified with allosteric modified peptides in a “plug-and-play” approach that recognizes the transmembrane domains of membrane proteins to mediate targeted delivery. c Allosteric targeting strategies mediate delivery to the brain, through the blood-brain barrier, via insulin receptors lacking ectodomain for the treatment of Alzheimer disease.
Fig. 2
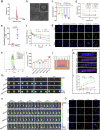
Fig. 2. Design and characterization of allosteric peptide that binds to the transmembrane domain of insulin receptor (IR-TM).
a Rational design flow chart of ITP and related sequence information. (1) Homodimer structure of the transmembrane domain (TMD) of insulin receptor (IR) (IR-TM chain A: blue ribbon, chain B: orange ribbon, PyMOL). (2) Sequence logo of top 5 designed unique sequences after the first round Rosetta Design. This image was created by weblogo (https://weblogo.berkeley.edu/logo.cgi). (3) 3D structures of the top 5 sequences, predicted by AlphaFold2, utilized for the second round of design. (4) The binding mode of transmembrane domain (TMD) of insulin receptor (IR) with ITP (IR-TM chain A: blue ribbon, ITP: cyan ribbon, PyMOL). (5) An overlay of chain B and ITP. The main chains are shown as tube representations, while side chains are displayed as sticks, with all amino acid side chains labeled in their respective colors (Discovery Studio Visualizer). (6) Sequences of the insulin transmembrane domain receptor, Chain B, and ITP. b Characterization of affinity between ITP and IR by surface plasmon resonance (SPR). c Quenching of coumarin-labeled insulin receptor protein fluorescence by binding to ITP or scrambled ITP. d–g Competitive binding assay demonstrates ITP binding to allosteric sites of IR by flow cytometry. Insulin was labeled with FITC. **p < 0.01, ***p < 0.001, ****p < 0.0001, NS not significant. h The effect of ITP on insulin activity in brain microvascular endothelial cells (BMECs); phosphorylation was characterized by western blotting. i Schematic representation of IR conformational changes monitored via time-resolved fluorescence resonance energy transfer (trFRET) approach (Created in BioRender. Tu, D. (2025) https://BioRender.com/n28f408). j Effect of increasing concentrations of insulin/ITP/Scrambled ITP on the trFRET signal measured with the SNAP-tagged IR. Statistical significance was tested with two-tailed unpaired Student’s t tests. Data in (bg, j) are presented as the mean ± SD (n = 3 biologically independent experiments). Data in (h) are representative of three independent experiments with similar results. Source data are provided as a Source Data file.
Fig. 3
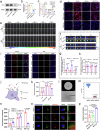
Fig. 3. Characterization of allosteric peptide-modified liposomes and their penetration through the blood-brain barrier.
a Size distribution and (b) transmission electron microscopy images of polyethyleneglycol ITP-modified liposomes (PEG-ITP-Lip) (scale bar = 50 nm). c Zeta potential of four liposomes. Data are presented as the mean ± SD (n = 3 biologically independent experiments). d–f Characterization of ITP modifications to improve the stability of liposomes. d The effect of ITP modification on membrane fluidity compared with cholesterol at different temperatures was characterized by measuring anisotropy values. Data are presented as the mean ± SD (n = 3 biologically independent experiments). e Young’s modulus of liposomes (Lip) and ITP-modified liposomes (ITP-Lip). Data are presented as the mean ± SD (n = 3 biologically independent experiments). *p < 0.05. f Fluorescence resonance energy transfer (FRET) efficiency of four liposomal formulations over 48 h of incubation with mouse serum. Liposomes were labeled with DiI and DiD. Data are presented as the mean ± SD (n = 3 biologically independent experiments). g–i In vitro uptake by bEnd.3 cells of liposomes modified with different ratios of ITP by (g) high content analysis system in confocal mode (Operetta CLS, PerkinElmer, USA) (scale bar = 10 μm) and (h, i) flow cytometry. Data are presented as the mean ± SD (n = 3 biologically independent experiments). ****p < 0.0001, **p < 0.01, NS not significant. j Schematic diagram of the in vitro BBB model (Created in BioRender. Tu, D. (2025) https://BioRender.com/h79d610). k Vertical 3D images of bEnd.3 monolayers (blue) interacting with liposomes (red). l Cumulative penetration of liposomes labeled with DiD (%) over 8 h. Data are presented as the mean ± SD (n = 3 biologically independent experiments). m Ex vivo and (n) in vivo fluorescence imaging of liposomes in normal mice with hair of brain and back removed. o The permeability of liposomes (green) in brain microvessels (red) as evaluated by immunofluorescence assay. The microvessels were stained with anti-CD34 antibody. Scale bar = 25 μm. Statistical significance was tested with two-tailed unpaired Student’s t tests. Data in (b, o) are representative of three independent experiments with similar results. Source data are provided as a Source Data file.
Fig. 4
Fig. 4. Evaluation of the mechanism by which allosteric peptide recognizes IR-TMD.
a Levels of insulin receptor (IR) protein in primary brain microvascular endothelial cells (BMECs) before and after siRNA transfection were evaluated by western blotting, with (b) corresponding semi-quantitative analysis. c, d The uptake of allosteric peptide-modified liposomes by BMECs was significantly decreased when IR expression was suppressed by siRNA transfection. Scale bar = 50 μm. e In vivo fluorescence imaging of PEG-Lip/PEG-ITP-Lip in Flox mice and brain-specific Insr-knockout mice (IR CKO) with hair of brain removed. f Ex vivo fluorescence imaging of PEG-Lip/PEG-ITP-Lip in Flox mice and Insr CKO mice, with (g, h) corresponding semi-quantitative analysis (normalized fluorescence intensity of (g) Flox or (h) CKO to PEG-Lip). i Distribution of liposomes in the brains of Flox mice (left) and CKO mice (right) and the co-localization of liposomes with IR, as characterized by immunofluorescence assay. White arrow indicates the co-localization of liposomes with IR. Scale bar = 50 μm. j Schematic diagram of using a peptide bound to the ectodomain of the IR (IEP) to block the IR (Created in BioRender. Ying, L. (2025) https://BioRender.com/ntzpswg). k Uptake of liposomes by BMECs with IEP blocking, as determined by flow cytometry. l Snapshot image of real-time single-cell multimodal analyzer, used to determine IR-α expression levels in BMECs treated or not treated with matric metalloproteinase 14 (MMP14). Scale bar = 20 μm. m Expression levels of IR-α on surfaces of BMECs treated or not treated with MMP14 as measured with a real-time single-cell multimodal analyzer. (F, Fluorescence intensity of IR-α on the cell membrane surface; F0: background fluorescence intensity of the culture dish). n Cellular uptake of liposomes by BMECs treated or not treated with MMP14. o Co-localization of liposomes with lysosomes, with (p) corresponding Pearson’s correlation coefficients. Scale bar = 5 μm. Statistical significance was tested with two-tailed unpaired Student’s t tests. *p < 0.05, **p < 0.01, ***p < 0.001, NS not significant. Data in (b, c, g, h, k, n, p) are presented as the mean ± SD (n = 3 biologically independent experiments). Data in (e, i) are representative of three independent experiments with similar results. Source data are provided as a Source Data file.
Fig. 5
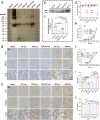
Fig. 5. Immunocompatibility of liposomes with allosteric peptide modifications.
a Separation of protein coronas on liposomes by SDS-PAGE. b IgM levels in protein coronas on liposomes, characterized by western blotting, with (c) corresponding semi-quantitative analysis. Data are presented as the mean ± SD (n = 3 biologically independent experiments). ***p < 0.001, **p < 0.01, *p < 0.05. d Body surface temperature of mice at 30 min after 3 doses of liposomes. The mice showed severe hypothermia when the RGD-Lip was given for the third time. e IgM and (f) IgG levels in the serum of mice with the corresponding liposomes as antigens at 1 h after the third dose were measured by indirect enzyme-linked immunosorbent assay. Data are presented as the mean ± SD (n = 3 biologically independent experiments). ***p < 0.001, **p < 0.01. g, h Immunohistochemical stains showing deposits of IgM and IgG immune complexes (red arrows) in liver, kidney, and lung at 1 h after the third dose. Scale bar = 50 μm. i IL-8 and (j) TNF-α levels in serum at 15 min after the third dose with liposomes. Data are presented as the mean ± SD (n = 3 biologically independent experiments). ***p < 0.001, **p < 0.01, NS not significant. Statistical significance was tested with two-tailed unpaired Student’s t tests. Data in (a) are representative of three independent experiments with similar results. Source data are provided as a Source Data file.
Fig. 6
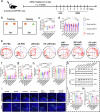
Fig. 6. Therapeutic evaluation of ITP-LNP/siBACE1 in a model of Alzheimer disease.
a Timeline for treatment of APP/PS1 or WT mice with siRNA-loaded lipid nanoparticles (ITP-LNP) or PBS by tail vein injection every 2 days. After treatment, the mice were given novel object recognition (NOR) and Morris water maze tests, after which serum and brain samples were obtained for subsequent evaluation. b Schematic diagram of the NOR test. The orange circle represents the familiar subject and the green triangle indicates the novel subject. c Discrimination index (DI) and (d) preference index (PI) findings from the NOR test. Data are presented as the mean ± SD (n = 6 biologically independent experiments). *p < 0.05, NS not significant. e Path diagram of APP/PS1 and WT mice performing the MWM test. The green dashed circles refer to the target platform in the MWM test. f Number of platform crossings, (g) time in the platform (s), (h) time in the target quadrant (%), and (i) swimming speed of mice in the MWM test. Data are presented as the mean ± SD (n = 6 biologically independent experiments). ***p < 0.001, **p < 0.01, *p < 0.05, NS not significant. j Immunofluorescence assays show deposition of β-amyloid (green) in the hippocampus and cortex of APP/PS1 and WT mice after treatment. Scale bar = 50 μm. k Expression levels of BACE1 protein in the hippocampus and cortex of APP/PS1 and WT mice after treatment, as characterized by western blotting, with (l, m) corresponding semi-quantitative analysis. Data are presented as the mean ± SD (n = 3 biologically independent experiments). ***p < 0.001, **p < 0.01, *p < 0.05. Statistical significance was tested with two-tailed unpaired Student’s t tests. Source data are provided as a Source Data file.
Fig. 7
Fig. 7. Allosteric targeting as a platform for drug delivery.
a The expression of eGFP protein in the brains of mice was evaluated by immunofluorescence assay after intravenous injection of lipid nanoparticles modified with the ITP and containing mRNA (ITP-LNP/mRNA) versus LNP/mRNA. Scale bar = 50 μm. b, c 3D fluorescence images of eGFP (green) in the brains of mice obtained by light sheet fluorescence microscopy at 24 h after administration of (b) LNP/mRNA or (c) ITP-LNP/mRNA. d In vitro uptake of Cy5-siRNA-loaded exosomes (Exo/siRNA) and Cy5-siRNA-loaded ITP-Exosome (ITP-Exo/siRNA) by bEnd.3 cells, measured by confocal laser scanning microscopy (scale bar = 10 μm). e In vitro uptake of Exo and ITP-Exo by bEnd.3 cells measured by flow cytometry. Exosomes were labeled with DiO. f The encapsulation efficiency of siRNA in the exosomes/ITP-modified exosomes was determined with a RiboGreen assay. g Design of the ITP2 peptide bound to αv transmembrane domain (αv-TM). The first row illustrates the evolution of the sequence during the design process, with main chains represented by ribbons of different colors and side chains shown as sticks (PyMOL). The color descriptions are provided in the “All Sequences” section of the second row. In the second row, on the left, an overlay of anti-αv and ITP2 is represented in green and orange, respectively. The main chains are depicted using line ribbon representation, while side chains are displayed as sticks (Discovery Studio Visualizer). On the right, the sequences of all chains in this figure are provided. In the designed ITP2, the red font indicates introduced amino acids, while cyan highlights and underlines represent amino acids that have not been altered. h, i Characterization of affinity between ITP2 (left) / c(RGDyK) (right) and bEnd.3 vesicles by surface plasmon resonance. j In vitro uptake of ITP2, scrambled ITP2/c(RGDyK)-modified liposomes (ITP2-Lip, SP-Lip, and RGD-Lip) by bEnd.3 cells, measured by flow cytometry. Statistical significance was tested with two-tailed unpaired Student’s t tests. *p < 0.05, **p < 0.01, ***p < 0.001. Data in (e, f, j) are presented as the mean ± SD (n = 3 biologically independent experiments). Source data are provided as a Source Data file.

Similar articles

Cited by

References

    1. Ulbrich, K., Knobloch, T. & Kreuter, J. Targeting the insulin receptor: nanoparticles for drug delivery across the blood-brain barrier (BBB). J. Drug Target.19, 125–132 (2011). - PubMed
    1. Scapin, G. et al. Structure of the insulin receptor–insulin complex by single-particle cryo-EM analysis. Nature556, 122–125 (2018). - PMC - PubMed
    1. Sun L. et al. Shed antigen-induced blocking effect on CAR-T cells targeting Glypican-3 in hepatocellular carcinoma. J. Immunother. Cancer9, e001875 (2021). - PMC - PubMed
    1. Montagut, C. et al. Identification of a mutation in the extracellular domain of the Epidermal Growth Factor Receptor conferring cetuximab resistance in colorectal cancer. Nat. Med.18, 221–223 (2012). - PubMed
    1. Wang, X. et al. Liposomes with cyclic RGD peptide motif triggers acute immune response in mice. J. Control. Release293, 201–214 (2019). - PubMed

LinkOut - more resources