. 2025 Apr 10;11(1):162.
doi: 10.1038/s41420-025-02433-9.

Mutant p53 upregulates HDAC6 to resist ER stress and facilitates Ku70 deacetylation, which prevents its degradation and mitigates DNA damage in colon cancer cells

Affiliations

Mutant p53 upregulates HDAC6 to resist ER stress and facilitates Ku70 deacetylation, which prevents its degradation and mitigates DNA damage in colon cancer cells

Rossella Benedetti et al. Cell Death Discov. .

Abstract

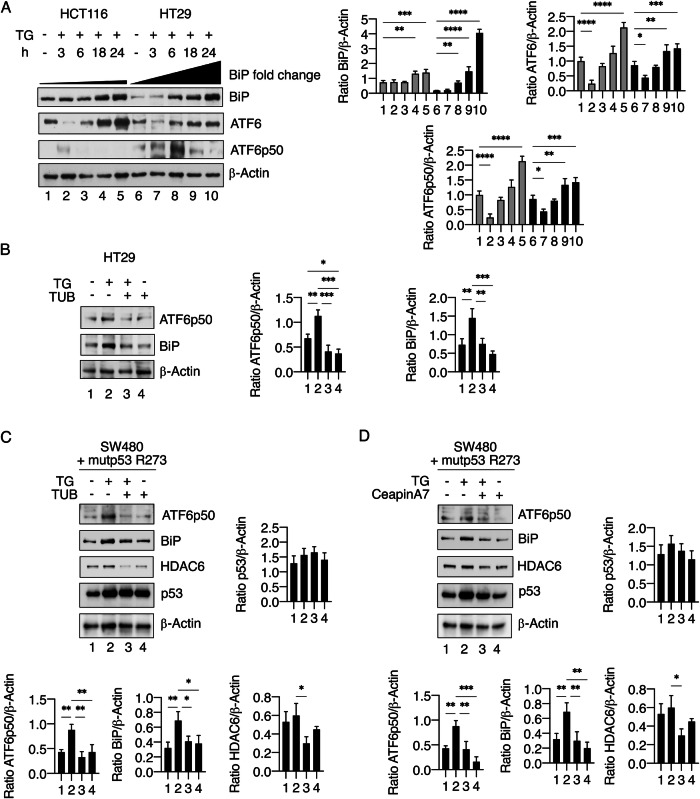
Cancer cells employ interconnected mechanisms to withstand intrinsic and extrinsic stress, with mutant p53 (mutp53) playing a key role in bolstering resistance to endoplasmic reticulum (ER) stress. In this study, we further investigated this phenomenon, focusing on the DNA damage triggered by ER stress. Our findings indicate that mutp53 mitigates ER stress-induced DNA damage by sustaining high levels of Ku70, a critical protein in DNA repair via the non-homologous end joining (NHEJ) pathway, which functions alongside Ku80. HDAC6 upregulation emerged as a crucial driver of this response. HDAC6 deacetylates Ku70, promoting its nuclear localization and protecting it from degradation. This mechanism ensures continuous activity of the NHEJ repair pathway, allowing mutp53-expressing cells to better manage DNA damage from ER stress, thus contributing to the genomic instability characteristic of cancer progression. Furthermore, HDAC6 maintains the activation of the ATF6 branch of the unfolded protein response (UPR), enhancing the ability of mutp53 cells to resist ER stress, as ATF6 supports cellular adaptation to misfolded proteins and stressful conditions. Since HDAC6 is central to this enhanced stress resistance and DNA repair, targeting it could disrupt these protective mechanisms, increasing the vulnerability of mutp53 cancer cells to ER stress and inhibiting cancer progression.


Conflict of interest statement

Competing interests: The authors declare no competing interests. Ethics approval: Ethics approval was not needed, as this study does not involve patients or animals.

Figures

Fig. 1
Fig. 1. Mutant p53 protects from DNA damage induced by ER stressor TG in colon cancer cell lines.
A Protein expression levels of CHOP, γ-H2AX, and BAX in HCT116 and HT29 cells treated with TG (100 nM) for the indicated time, as evaluated by western blot analysis. β-Actin was used as a loading control and one representative experiment is shown. The histograms represent the densitometric analysis of the ratio of specific proteins and the appropriate control. The data are represented as the mean plus S.D. from three different experiments. B γ-H2AX foci (red) were assessed by IFA in HCT116 and HT29 cells treated with TG for 18 h. DAPI (blue) was used for nuclear staining. One representative experiment out of three is reported. The histograms represent the mean plus S.D. of the number of γ-H2AX foci/cell. Bars = 50 µm. C Protein expression levels of mutp53 and γ-H2AX in HT29 cells transfected with pSuper-p53 (sip53) or empty-vector (EV) before treatment with TG. β-Actin was used as a loading control and one representative experiment is shown. The histograms represent the densitometric analysis of the ratio of specific protein/β-Actin. The data are represented as the mean plus S.D. from three different experiments. D Protein expression levels of p53 and γ-H2AX in HCT116 p53−/− transfected with pcDNA3-p53 (wtp53), pcDNA3-p53R273H (mutp53) or empty-vector (EV) and then treated or not with TG, as evaluated by western blot analysis. β-Actin was used as a loading control and one representative experiment is shown. Histograms represent the densitometric analysis of the ratio of specific protein/β-Actin. The data are represented as the mean plus S.D. from three different experiments. p value *<0.05, **<0.01, ***<0.001, ****<0.0001.
Fig. 2
Fig. 2. Mutant p53 sustains DNA damage repair protein expression, particularly Ku70 and Ku80, in TG-treated cells.
A Western blot analysis showing the expression levels of BRCA1, Rad51, Ku70, and Ku80 in HCT116, RKO, SW480, and HT29 cells treated or not with TG. β-Actin was used as a loading control and one representative experiment is shown. The histograms represent the densitometric analysis of the ratio of specific proteins/β-Actin. The data are represented as the mean plus S.D. from three different experiments. B Protein expression level of Ku70 in HCT116 and HT29 cells treated with TG (100 nM) for the indicated time in combination with Cycloheximide (CHX). β-Actin was used as loading control and one representative experiment is shown. The histograms represent the densitometric analysis of the ratio of Ku70/β-Actin. The data are represented as the mean plus S.D. from three different experiments. C Western blot analysis showing the expression levels of BRCA1, Rad51, Ku70, and Ku80 in HCT116 and HT29 cells treated with TG (100 nM) in combination or not with bortezomib (BZ) or ammonium chloride (NH4Cl). β-Actin was used as loading control and one representative experiment is shown. The histograms represent the densitometric analysis of the ratio of specific proteins/β-Actin. The data are represented as the mean plus S.D. from three different experiments. D Protein expression levels of mutp53, BRCA1, Rad51, Ku70, and Ku80 in HT29 cells transfected with pSuper-p53 (sip53) or empty-vector (EV) before treatment with TG. β-Actin was used as loading control and one representative experiment is shown. The histograms represent the densitometric analysis of the ratio of specific protein/β-Actin. The data are represented as the mean plus S.D. from three different experiments. E Protein expression levels of p53, BRCA1, Rad51, Ku70, and Ku80 in HCT116 p53−/− transfected with pcDNA3-p53 (wtp53), pcDNA3-p53R273H (mutp53) or empty-vector (EV) and then treated or not with TG, as evaluated by western blot analysis. β-Actin was used as loading control and one representative experiment is shown. Histograms represent the densitometric analysis of the ratio of specific proteins/β-Actin. The data are represented as the mean plus S.D. from three different. p value *<0.05, **<0.01, ***<0.001, ****<0.0001.
Fig. 3
Fig. 3. HDAC6 regulation contributes to the different Ku70 acetylation and expression in wild-type and mutant p53 cells treated with TG.
A Acetylation levels of Ku70 and HDAC6 interaction as evaluated by western blot analysis after immunoprecipitation (IP) with anti-Ku70 antibody in RKO and SW480 cells treated or not with TG (100 nM) for 18 h. Pre-clearing supernatant (Pre-cl.) was used as non-specific binding control. One representative experiment out of three is shown. Histograms represent the mean plus S.D. of the densitometric analysis of the ratio of acetylate-Lysine/Ku70. B Western blot analysis showing the expression levels of HDAC6 in HCT116, RKO, and SW480 and HT29 cells treated or not with TG. β-Actin was used as loading control and one representative experiment is shown. The histograms represent the densitometric analysis of the ratio of HDAC6/β-Actin. The data are represented as the mean plus S.D. from three different experiments. C Protein expression levels of mutp53 and HDAC6 in HT29 cells transfected with pSuper-p53 (sip53) or empty-vector (EV) before treatment with TG (100 nM). β-Actin was used as loading control and one representative experiment is shown. The histograms represent the densitometric analysis of the ratio of HDAC6/β-Actin. The data are represented as the mean plus S.D. from three different experiments. D Protein expression levels of p53 and HDAC6 in HCT116 p53−/− transfected with pcDNA3-p53 (wtp53), pcDNA3-p53R273H (mutp53) or empty-vector (EV) and then treated or not with TG (100 nM), as evaluated by western blot analysis. β-Actin was used as loading control and one representative experiment is shown. Histograms represent the densitometric analysis of the ratio of HDAC6/β-Actin. The data are represented as the mean plus S.D. from three different experiments. E Acetylation levels of Ku70 as evaluated by western blot analysis after immunoprecipitation with anti-acetyl-Lysine (ac-Lys) antibody or crude lysate (Input) in SW480 cells pre-treated with tubacin (TUB) and then treated or not with TG for 18 h. Pre-clearing supernatant (Pre-cl.) was used as a non-specific binding control. One representative experiment out of three is shown. Histograms represent the mean plus S.D. of the densitometric analysis of the Ku70 ratio after immunoprecipitation relative to the Input. F Protein expression levels of HDAC6 and Ku70 in SW480 cells transfected with HDAC6 siRNA (siHDAC6) or control siRNA-A (scr) before treatment with TG. β-Actin was used as loading control and one representative experiment is shown. The histograms represent the densitometric analysis of the ratio of specific proteins/β-Actin. The data are represented as the mean plus S.D. from three different experiments. G, H Protein expression levels of Ku70 and mutp53 in SW480 cells exposed or not with TG after pre-treatment with TUB or SAHA, as evaluated by western blot analysis. β-Actin was used as loading control and one representative experiment is shown. The histograms represent the densitometric analysis of the ratio of specific proteins/β-Actin. The data are represented as the mean plus S.D. from three different experiments. I Western blot analysis of Ku70 and mutp53 in SW480 transfected with pcDNA3-p53R273H (mutp53) vector, pre-treated with TUB and then treated or not with TG. The histograms represent the densitometric analysis of the ratio of specific protein/β-Actin. The data are represented as the mean plus S.D. from three different experiments. p value *<0.05, **<0.01, ***<0.001.
Fig. 4
Fig. 4. TG influences Ku70 import/export affecting its expression level in wild-type and mutant p53 cells.
A Ku70 localization was evaluated by western blot analysis performed after nuclear/cytoplasmic fractionation in HCT116 and HT29 cells treated or not with TG (100 nM) for 18 h. β-Actin or Lamin C was used as a loading control and one representative experiment is shown. The histograms represent the densitometric analysis of the ratio of Ku70 and the appropriate control. The data are represented as the mean plus S.D. from three different experiments. B Immunofluorescence for Ku70 (green) in HCT116 and SW480 cells treated or not with TG (100 nM). Blue: DAPI staining. Scale bars = 20 µm. C Ku70 localization was evaluated by western blot analysis performed after nuclear/cytoplasmic fractionation in HT29 cells pre-treated with tubacin (TUB) before adding TG (100 nM). β-Actin or Lamin C was used as loading control and one representative experiment is shown. The histograms represent the densitometric analysis of the ratio of Ku70 and the appropriate control. The data are represented as the mean plus S.D. from three different experiments. D Protein interaction of Importin α, Exportin 1, and MDM2 with Ku70 as evaluated by western blot analysis after immunoprecipitation (IP) in RKO and SW480 cells treated or not with TG (100 nM) for 18 h. Pre-clearing supernatant (Pre-cl.) was used as non-specific binding control. One representative experiment out of three is shown. E, F Protein expression levels of Ku70 in RKO or SW480 cells treated or not with TG (100 nM) after pre-treatment with leptomycin B (LMB) or ivermectin (IVM) as evaluated by western blot analysis. β-Actin was used as loading control and one representative experiment is shown. The histograms represent the densitometric analysis of the ratio of Ku70/β-Actin. The data are represented as the mean plus S.D. from three different experiments. p value *<0.05, **<0.01.
Fig. 5
Fig. 5. HDAC6 protects from ER stress by sustaining ATF6 activation.
A Protein expression level of BiP, ATF6, and ATF6p50 in HCT116 and HT29 cells treated with TG (100 nM) for the indicated time as evaluated by western blot analysis. β-Actin was used as loading control and one representative experiment is shown. The histograms represent the densitometric analysis of the ratio of specific protein and the appropriate control. The data are represented as the mean plus S.D. from three different experiments. B Protein expression level of ATF6p50 and BiP in HT29 cells pre-treated with tubacin (TUB) and then treated with TG (100 nM) for 18 h. β-Actin was used as loading control and one representative experiment is shown. The histograms represent the densitometric analysis of the ratio of specific protein and the appropriate control. The data are represented as the mean plus S.D. from three different experiments. C Western blot analysis of HDAC6, ATF6, BiP, and mutp53 in SW480 transfected with pcDNA3-p53R273H (mutp53) vector and then treated or not with TG after pre-treatment with TUB. β-Actin was used as loading control and one representative experiment is shown. The histograms represent the densitometric analysis of the ratio of specific protein and the appropriate control. The data are represented as the mean plus S.D. from three different experiments. D Western blot analysis of HDAC6, ATF6, BiP, and mutp53 in SW480 transfected with pcDNA3-p53R273H (mutp53) vector, then pre-treated with ceapinA7 and treated or not with TG. β-Actin was used as loading control and one representative experiment is shown. The histograms represent the densitometric analysis of the ratio of specific protein and the appropriate control. The data are represented as the mean plus S.D. from three different experiments. p value *<0.05, **<0.01, ***<0.001, ****<0.0001.
Fig. 6
Fig. 6. HDAC6 is upregulated in colorectal cancer patient samples with mutated p53 compared to those with wild-type p53.
Volcano plot of differentially expressed genes between mutant p53 and wild-type p53 primary tumor samples from colorectal cancer patients, obtained from GEO2R analysis of an expression array dataset. Each point in the plot represents a gene, with the x-axis showing the magnitude of change (log2 fold change) and the y-axis indicating statistical significance (−log10 P value). Highlighted genes are significantly differentially expressed at an adjusted p value cutoff of 0.05 (red = upregulated, blue = downregulated). The point representing HDAC6 is marked by an arrow (log2 fold change = 0.189, −log10 P value = 4).

References

    1. Gonzalez-Quiroz M, Blondel A, Sagredo A, Hetz C, Chevet E, Pedeux R. When endoplasmic reticulum proteostasis meets the DNA damage response. Trends Cell Biol. 2020;30:881–91. - PubMed
    1. Hetz C, Chevet E, Oakes SA. Proteostasis control by the unfolded protein response. Nat Cell Biol. 2015;17:829–38. - PMC - PubMed
    1. Groelly FJ, Fawkes M, Dagg RA, Blackford AN, Tarsounas M. Targeting DNA damage response pathways in cancer. Nat Rev Cancer. 2023;23:78–94. - PubMed
    1. Her J, Bunting SF. How cells ensure correct repair of DNA double-strand breaks. J Biol Chem. 2018;293:10502–11. - PMC - PubMed
    1. Ryu HW, Won HR, Lee DH, Kwon SH. HDAC6 regulates sensitivity to cell death in response to stress and post-stress recovery. Cell Stress Chaperones. 2017;22:253–61. - PMC - PubMed

LinkOut - more resources