. 2025 Apr 10;16(1):3391.
doi: 10.1038/s41467-025-58490-2.

FRET imaging of glycoRNA on small extracellular vesicles enabling sensitive cancer diagnostics

Affiliations

FRET imaging of glycoRNA on small extracellular vesicles enabling sensitive cancer diagnostics

Tingju Ren et al. Nat Commun. .

Abstract

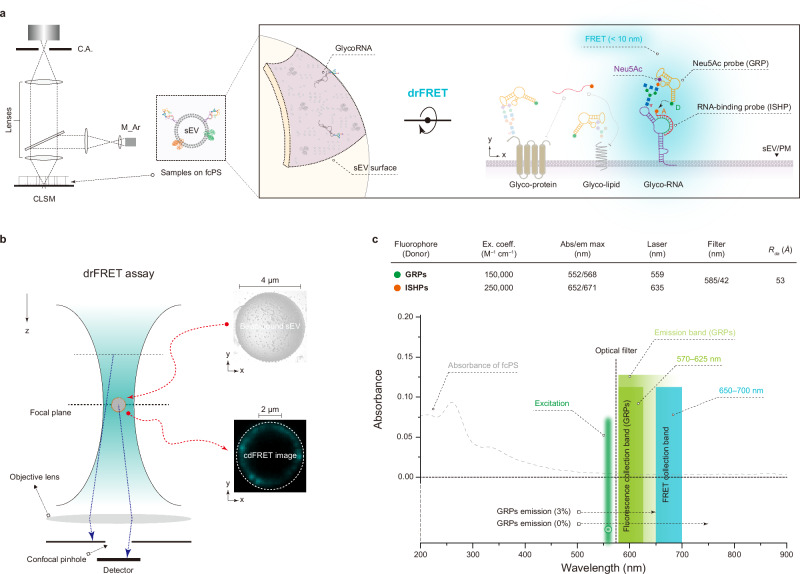
Glycosylated RNAs (glycoRNAs), a recently discovered class of membrane-associated glyco-molecules, remain poorly understood in function and clinical value due to limited detection methods. Here, we show a dual recognition Förster resonance energy transfer (drFRET) strategy using nucleic acid probes to detect N-acetylneuraminic acid-modified RNAs, enabling sensitive, selective profiling of glycoRNAs on small extracellular vesicles (sEVs) from minimal biofluids (10 μl initial biofluid). Using drFRET, we identify 5 prevalent sEV glycoRNAs derived from 7 cancer cell lines. In a 100-patient cohort (6 cancer types and non-cancer controls), sEV glycoRNA profiles achieve 100% accuracy (95% confidence interval) in distinguishing cancers from non-cancer cases and 89% accuracy in classifying specific cancer types. Furthermore, drFRET reveal that sEV glycoRNAs specifically interact with Siglec proteins and P-selectin, which is critical for sEV cellular internalization. The drFRET strategy provides a versatile and sensitive platform for the imaging and functional analysis of sEV glycoRNAs, with promising implications for clinical applications.


Conflict of interest statement

Competing interests: The authors declare no competing interests.

Figures

Fig. 1
Fig. 1. Presence of glycoRNAs on sEVs.
a Incorporation of Ac4ManNAz, a glycan reporter, into sEV RNAs. Cartoon highlighting the glycoRNA anchoring onto the surface of sEVs, a process that has not been previously characterized. Ac4ManNAz, peracetylated N-azidoacetylmannosamine. b Schematic diagram illustrating strategy for metabolic labeling. c Schematic of sEV RNA extraction protocol. Prot. K, proteinase K; DBCO, dibenzocyclooctyne. d RNA blotting of RNA extracted from HeLa cell-derived sEVs and HeLa cells treated with 100 μM Ac4ManNAz for the indicated duration. After sEV isolation and RNA purification, Ac4ManNAz was conjugated to DBCO-PEG4-biotin, visualized via a chemiluminescent nucleic acid detection module (Strep, bottom), and scanned with an ultra-sensitive chemiluminescence imaging system. Before RNA transfer to the nitrocellulose membrane, total RNA was stained and imaged with YeaRed reagent (YeaRed, top) to interrogate quality and loading. The regions where glycoRNAs are present are highlighted in red text, while non-specific labeling (nsl) is also indicated. Molecular weight standard: DNA ladder (DNA Marker 2000, see Methods for more information). Notably, the use of a DNA ladder limited the precise determination of molecular weight. Representative images are shown. 3 s: exposure time. e The gray values of different lanes along the dotted line direction in (d) are shown in the histograms. f Dot blotting of RNA from HeLa cells-derived sEVs. Representative images from separate blots are shown. Data are representative of two independent experiments with similar results. g Expression of sEV glycoRNAs analyzed by chemiluminescence dot-blot. GlycoRNAs were metabolically labeled by 100 μM Ac4ManNAz and 100 μM Ac4GalNAz (N-azidoacetylgalactosamine-tetraacylated), respectively. An equal quantity of RNAs was spotted on the polyvinylidene difluoride membranes prior to staining. Data are representative of three independent experiments with similar results. Representative images from separate blots are shown. Data in (g) are shown as mean ± s.d. Normalized units (norm.); arbitrary units (arb.). Source data are provided as a Source Data file.
Fig. 2
Fig. 2. Development of drFRET for in situ imaging sEV glycoRNAs.
a Schematic illustration of in situ FRET imaging of glycoRNAs. ISHPs were used for in situ hybridization of RNAs, whereas GRPs for specific targeting Neu5Ac. FRET occurs only when dual recognition of Neu5Ac and RNAs within a proximity of 10 nm. b Schematic of the confocal FRET imaging of sEV glycoRNAs. The bead-bound sEVs were uniformly deposited onto the focal plane of the microscope, and the FRET signal was automatically corrected using the sensitized emission method. The FRET efficiency and distance between GRPs (donor) and ISHPs (acceptor) were calculated. c Fluorophore photophysical properties, and our selection of wavelength for excitation (559 nm, green), optical filter (585 nm), and FRET collection band (650–700 nm, cyan). Excitation/readout optics and calculated inter-dye Förster radii (Rda). The ultraviolet-visible diffuse reflectance spectrum of the optically inert carrier fcPS is represented by the gray dashed line, which exhibits no absorption within the drFRET optical analysis bands.
Fig. 3
Fig. 3. In situ FRET imaging of glycoRNAs on cancer-derived sEVs.
a Representative TEM images of sEVs derived from patient serum and cell culture supernatant, respectively. b SEM characterization of sEVs captured on beads. c Size distribution of sEVs characterized by NTA and SEM (n = 300 vesicles), respectively. d Confocal laser scanning microscopy (CLSM) images (cdFRET channel) of sEV glycoRNAs and various control groups in the absence of components for FRET imaging. sEVCP, sEV capture probe. m, cell culture medium. s, serum. Scale bars: 2 μm. e Quantification of average cdFRET intensity in (d). f Schematic illustration of specificity analysis for sEV glycoRNA FRET imaging and representative CLSM images of glycoRNAs on sEVs from cells treated with glycosylation inhibitors (left panel). Quantification of average cdFRET intensity (right panel). g Validation of the specificity for drFRET. sGRPs: glycan probe using DNA with scrambled sequence; us-ISHPs: unspecific RNA binding probes (see Supplementary Table 1 for detailed sequence information). n  =  3 frames. All data are representative of three independent experiments. Data in (f and g) are shown as mean ± s.d. Statistical significance in (e, f, and g) was determined by a two-tailed Student’s t test. P-values are indicated in the charts.
Fig. 4
Fig. 4. FRET imaging of sEV glycoRNAs in seven cell lines.
a Representative cdFRET images of glycoRNA expression in low concentrations of sEVs (csEV: 5.0 × 103 − 5.0 × 109 ml−1) by FRET imaging. b Regression analysis of the average cdFRET intensity of glycoRNAs on bead-bound sEVs as a function of sEV concentration. n = 3 samples for each sEV count; data are presented as mean ± s.d. LOD, limit of detection. c In situ FRET imaging of glycoRNAs on fcPS-captured sEVs derived from different cell lines (upper panel), and quantification of average cdFRET intensity (lower panel). Scale bar, 4 μm. Different sEVs were isolated from different cell culture supernatants using differential ultracentrifugation, and their particle concentrations were quantified by NTA (for detailed methodology, see Methods). For drFRET assays, sEV samples with identical particle concentrations (5.0 × 109 ml−1) were employed, the original concentrations are provided in Supplementary Table 8. n = 3 samples for each cell line sEVs, data are shown as mean ± s.d. d PCA showing the discrimination of 7 cell line groups using the combination of the cdFRET signals of 5 sEV glycoRNAs. Sample groups are color-coded as indicated.
Fig. 5
Fig. 5. In situ FRET imaging revealing multiple glycoRNA alterations in cancers.
a A heat map constructed by non-supervised hierarchical clustering of the levels of five glycoRNAs in the training cohort (n = 70) and the validation cohort (n = 30) for differentiating the cancer and non-cancer control groups. Clustering analysis was performed with Ward linkage and Euclidean distance. Samples are marked and colored (bottom). Data are the mean of triplicate experiments. b ROC curves (left) for discriminating non-cancer (n =  8) and all cancer samples (n =  62) in the training cohort using a logistic regression model, and PRC curves (right). The gray diagonal line indicates the expected curve for random classification. Bottom: the AUC, GINI indexes, and overall model quality (OMQ) are shown for glycoRNAs (detailed data description and summary are presented in Supplementary Table 2–3). The OMQ values exceeding 0.5 indicate the effectiveness of good models, while below 0.5 suggests that the model is not merely a result of random prediction. c ROC curves (left) for discriminating non-cancer (n = 4) and all cancer samples (n = 26) in the validation cohort, and PRC curves (right). Bottom: the AUC, GINI indexes, and OMQ are shown for glycoRNAs (Supplementary Table 2–3). Source data are provided as a Source Data file.
Fig. 6
Fig. 6. Accurate cancer diagnostics enabled by sEV glycoRNA profiles.
a The cdFRET intensity all five glycoRNAs and their unweighted sum (sEVSUM) of cancer-derived sEVs (n =  88; means ± s.e.m.) compared with sEVs from non-cancer controls (n = 12; means ± s.e.m.) within the entire test set. Statistical differences were determined by a two-tailed heteroscedastic t test. P-values are indicated in the charts. b AUC for evaluating the performance of sEV glycoRNAs in discriminating distinct cancer types (detailed data description and summary are presented in Supplementary Tables 4and 5). c Visualized classification performance in the entire test set using PCoA mapping, wherein cancer individuals were classified into different cancer types based on all five glycoRNAs (sEVSUM (glycoRNA)) as inputs. Sample groups are color-coded as indicated, and each dot represents a serum sample. Each ellipse represents the 95% CI for the barycentre of each group. d Confusion matrix providing a comprehensive summary of the multi-cancer classification results in the entire test set.
Fig. 7
Fig. 7. In situ FRET imaging revealing the involvement of sEV glycoRNAs in the binding of Siglec proteins.
a Schematic diagram of the in situ FRET imaging of sEV glycoRNA binding to Siglec proteins. Predicted binding locations of the ISHPs and Siglec-Fc proteins (e.g., Siglec-10) are highlighted. b The AlphaFold predicted structures of Siglec-10, Siglec-11, and P-selectin. pLDDT corresponds to the model’s prediction of its score on the local Distance Difference Test. AlphaFold produces a per-residue model confidence score (pLDDT) between 0 and 100. Some regions below 50 pLDDT may be unstructured in isolation. AlphaFold Protein Structure Database, https://alphafold.ebi.ac.uk/. c FCM analysis of bead-bound sEVs pre-treated with the indicated enzymes or inhibitors, followed by staining with the Cy3-conjugated Siglec-10. The gated region indicates that the population shifted toward high Siglec-10 binding. d Quantitative analysis of the positivity rate (Cy3 channel) depicted in (c). e Validation of the specific binding of glycoRNAs to Siglec-10. sEVs were pre-treated with RNase A and analyzed by FRET imaging (top). Scale bars: 10 μm (raw); 2 μm (enlarged). Quantification of average cdFRET intensity (bottom). f Representative cdFRET images of glycoRNA captured by using Cy3-conjugated Siglec-11 and Cy3-conjugated P-selectin for FRET assay. Scale bars: 10 μm (raw); 2 μm (enlarged). The red numbers represent the average intensities of the cdFRET signals. Data in (d and e) are shown as mean ± s.d. Statistical significance in (d and e) was determined by a two-tailed Student’s t test. P-values are indicated in the charts. All data are representative of three independent experiments.
Fig. 8
Fig. 8. Reducing cellular uptake by ablating surface RNAs on sEVs.
a Cartoon model of glycoRNA-mediated cellular uptake of tumor-derived sEVs. b Ablating surface RNAs reduces sEV-endothelial cell interaction. c Confocal micrographs showing different internalization of sEVs pre-treated with PNGase F, α2-3,6,8,9 Neuraminidase A, and RNase A, respectively. Arrowheads indicate internalized sEVs. Micrographs are representative of three independent experiments. The intensities of different fluorochromes along the white lane in the magnified images are shown in the histograms on the right. Scale bars: 20 μm (raw); 10 μm (magnification). The pseudo-color bar in the inset represents fluorescence intensity. d Analysis of sEV internalization in cells. Data are shown as mean ± s.d. Statistical significance was determined by a two-tailed Student’s t test. P-values are indicated in the charts. e Representative orthogonal slice images of DiI-labeled sEVs in a Hoechst 33258-labeled HUVEC cell. Left: fixed cells were subjected to Z-scanning, resulting in the acquisition of 150 images that were subsequently utilized for 3D reconstruction. Right: the orthogonal view reveals a predominant intracellular distribution of sEVs. All data are representative of three independent experiments.

Similar articles

References

    1. Huang, N. et al. Natural display of nuclear-encoded RNA on the cell surface and its impact on cell interaction. Genome Biol.21, 225 (2020). - PMC - PubMed
    1. Flynn, R. A. et al. Small RNAs are modified with N-glycans and displayed on the surface of living cells. Cell184, 3109–3124 (2021). - PMC - PubMed
    1. Suzuki, T. The expanding world of tRNA modifications and their disease relevance. Nat. Rev. Mol. Cell Biol.22, 375–392 (2021). - PubMed
    1. Helm, M. & Motorin, Y. Detecting RNA modifications in the epitranscriptome: predict and validate. Nat. Rev. Genet.18, 275–291 (2017). - PubMed
    1. Li, Y. et al. N6-Methyladenosine co-transcriptionally directs the demethylation of histone H3K9me2. Nat. Genet.52, 870–877 (2020). - PubMed

LinkOut - more resources