Clinical Trial
. 2025 Apr 11;16(1):3432.
doi: 10.1038/s41467-025-58632-6.

Early-life gut microbiome associates with positive vaccine take and shedding in neonatal schedule of the human neonatal rotavirus vaccine RV3-BB

Affiliations
Clinical Trial

Early-life gut microbiome associates with positive vaccine take and shedding in neonatal schedule of the human neonatal rotavirus vaccine RV3-BB

Josef Wagner et al. Nat Commun. .

Abstract

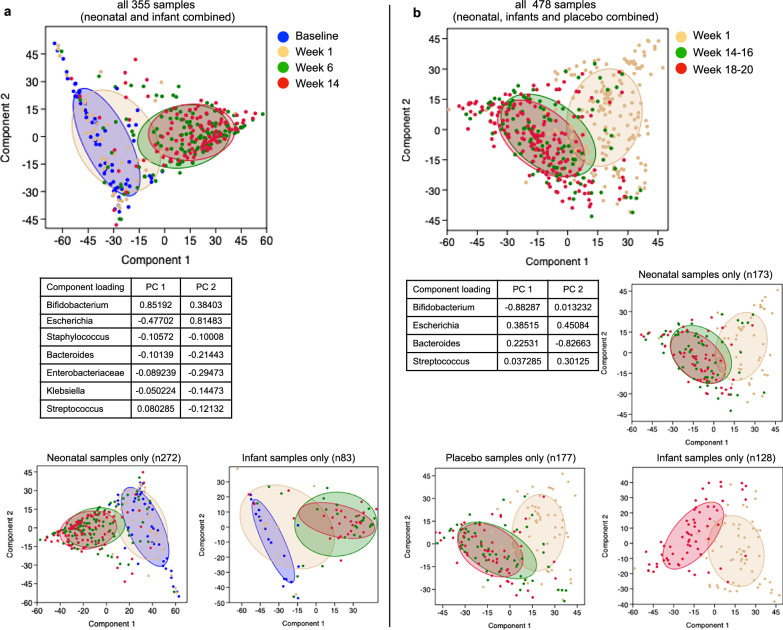
Rotavirus vaccines are less effective in high mortality regions. A rotavirus vaccine administered at birth may overcome challenges to vaccine uptake posed by a complex gut microbiome. We investigated the association between the microbiome and vaccine responses following RV3-BB vaccine (G3P[6]) administered in a neonatal schedule (dose 1: 0-5 days), or infant schedule (dose 1: 6-8 weeks) in Indonesia (Phase 2b efficacy study) (n = 478 samples/193 infants) (ACTRN12612001282875) and in Malawi (Immunigenicity study) (n = 355 samples/186 infants) (NCT03483116). Vaccine responses assessed using anti-rotavirus IgA seroconversion (IgA), stool shedding of vaccine virus and vaccine take (IgA seroconversion and/or shedding). Here we report, high alpha diversity, beta diversity differences and high abundance of Bacteroides is associated with positive vaccine take and shedding following RV3-BB administered in the neonatal schedule, but not with IgA seroconversion, or in the infant schedule. Higher alpha diversity was associated with shedding after three doses of RV3-BB in the neonatal schedule compared to non-shedders, or the placebo group. High abundance of Streptococcus and Staphylococcus is associated with no shedding in the neonatal schedule group. RV3-BB vaccine administered in a neonatal schedule modulates the early microbiome environment and presents a window of opportunity to optimise protection from rotavirus disease.


Conflict of interest statement

Competing interests: MCRI holds the patent for the RV3-BB vaccine; J.W., J.E.B., A.H., C.M.D., E.L., D.S.O., R.B., D.P., N.B.D., K.B., J.P.B., E.W., and F.J. are employees of MCRI. C.M.D. has served on advisory boards for GSK (2019, 2021), with all payments directed to an administrative fund held by MCRI. N.C. is a National Institute for Health and Care Research (NIHR) Senior Investigator (NIHR203756). N.C., D.W., A.T., and K.C.J. are affiliated to the NIHR Global Health Research Group on Gastrointestinal Infections at the University of Liverpool; and to the NIHR Health Protection Research Unit in Gastrointestinal Infections at the University of Liverpool, a partnership with the UK Health Security Agency in collaboration with the University of Warwick. The views expressed are those of the author(s) and not necessarily those of the NIHR, the Department of Health and Social Care, the UK government or the UK Health Security Agency. All the remaining authors do not have competing interests.

Figures

Fig. 1
Fig. 1. RV3-BB Microbiome Study Participant Flow and Vaccine Schedule Flow.
a The Malawi neonatal and infant vaccine schedule groups and the number and timing of sample collection for the vaccine and placebo doses. b The Indonesia neonatal and infant vaccine schedule groups and placebo group and the number and timing of sample collection for the different vaccine and placebo doses.
Fig. 2
Fig. 2. Alpha diversity analysis for the RV3-BB Malawi participants in the Neonatal vaccine schedule group.
The alpha diversity was analysed between the negative vaccine response group (N, light blue colour for vaccine take and light orange for shedding) and the positive vaccine response group (Y, dark blue colour for vaccine take and dark orange for shedding) for the vaccine variables “Vaccine take” and “Shedding”. The data are presented for the baseline group in (a), for the week 1 group in (b), for the week group 6 in (c), and for the week 14 group in (d). The analysis included three distinct alpha diversity indexes: Fisher’s index, Simpson’s index, and observed richness measure. The analysis was conducted on three vaccine doses: dose 1 (d1), dose 2 (d2), and dose 4 (marked d4*as this time point is after three doses of vaccine and one dose of placebo). The data were tested for normal distribution using the Shapiro-Wilk and Kolmogorov-Smirnov tests. For normally distributed data, a two-tailed parametric unpaired t test was employed, whereas, for non-normally distributed data, a two-tailed non-parametric unpaired Mann-Whitney test was used. Data are presented in a box and whisker plot. The box extends from the 25th to the 75th percentile, and the line in the middle is plotted at the median. The whiskers represent the 10–90 percentiles. All data points outside the 10–90 percentile are shown All statistical tests and graph generation were conducted in GraphPad Prism 10 for macOS (v 10.3.0). All the individual numbers used for box plot generation are presented in Table 2 and Supplementary Table 4.
Fig. 3
Fig. 3. Alpha diversity analysis for the RV3-BB Indonesia participants in the Neonatal and Placebo vaccine schedule group.
Alpha diversity was analysed between the negative vaccine response group (N, light orange colour) and the positive vaccine response group (Y, dark orange colour) for the vaccine variables ‘stool shedding’ across three timepoints, (a) for week 1, (b) for week 14, and (c) for week 18. The analysis included three different alpha diversity indices: Fisher’s index, Simpson’s index and Richness measure. Fisher’s index and observed richness measure are shown here. None of the Simpson’s alpha indices were statistically significant between the vaccine groups and are not shown here. The results of Simpson’s alpha index are shown in Table 2. The analysis was conducted on three vaccine doses: dose 1 (d1), dose 2 (d2), and dose 4* (d4* dose 4 is after three doses of vaccine and one dose of placebo). Alpha diversity – cross-analysis between the neonatal and placebo groups for shedding at week 14 shown in (d) and week 18 shown in (e) for the Indonesian cohort. The objective was to test for differences between the positive vaccine response for shedding in the neonatal vaccinated group and the combined placebo-matched dosing group. Only those groups that exhibited a statistically significant difference between the vaccine response group and the non-vaccine response group with regard to shedding were subjected to further analysis through cross-validation. Data were tested for normal distribution using the Shapiro-Wilk and Kolmogorov-Smirnov tests. A two-tailed parametric unpaired t test was used for normally distributed data, and a two-tailed non-parametric unpaired Mann-Whitney test was used for non-normally distributed data. The P-value across the three different time points was corrected using the Benjamin-Hochberg correction method. The uncorrected P-values are shown in Supplementary Table 4. Data are presented in a box and whisker plot. The box extends from the 25th to the 75th percentile, and the line in the middle is plotted at the median. The whiskers represent the 10–90 percentiles. All data points outside the 10–90 percentile are shown. All the individual numbers used for box plot generation are presented in Table 2 and Supplementary Table 4. All statistical tests and graph generation were performed in GraphPad Prism 10 for MacOS (v 10.3.0).
Fig. 4
Fig. 4. Principal co-ordinate analysis (PCoA) between the positive and negative vaccine take group and stool shedding group in the neonatal vaccine schedule group in RV3-BB Malawi and Indonesia study cohorts.
PCoA based on the Bray-Curtis distance matrix performed in the Malawi study neonatal vaccine schedule group at week 6 showed a distinct bacterial cluster between participants with positive and negative vaccine take (a) and positive or negative stool shedding (b) following administration of vaccine at dose 2 and at dose 4 (following three doses of vaccine and one dose of placebo [Fig. 1]). c In the Indonesia neonatal vaccine schedule group, the most pronounced bacterial clusters were observed for stool shedding at dose 3 and, to a lesser extent, at dose 4. The PCoA was performed using the Palaeontological Statistic software package for training and data analysis (v PAST 4.04) with 9999 permutations on Total Sum Scaling (TSS)-transformed data. The confidence ellipse was plotted at 50%. The FDR corrected significant P-value from the one-sided beta-diversity Permutational Multivariate Analysis of Variance test has been added to each PCoA plot. Since the test only evaluates whether the observed pseudo-F is greater than expected under the null, it is inherently one-sided. Adonis PERMANOVA test, commonly implemented in R’s vegan package, is a one-sided test by default.
Fig. 5
Fig. 5. Increased alpha diversity over time in the RV3-BB Malawi and Indonesia study cohorts.
ac Alpha diversity using the Fisher’s alpha index, Simpson’s index and Observed Richness were compared between time points for the Malawi, and the Indonesia cohort (df), independent of vaccine response. gi Fisher’s alpha index, Simpson’s index and Observed Richness analysis for the Malawi cohort separated by time points. jl Fisher’s alpha index, Simpson’s index and Observed Richness analysis for the Indonesia cohort separated by time points. Data were tested for Gaussian distribution using the Anderson-Darling and Shapiro-Wilk tests. Data were not normally distributed, and therefore, the two-sided non-parametric Skillings-Mack test for incompletely matched data with Dunn’s multiple comparisons test was used for analysis. Only p-values < 0.05 are shown for this time-point analysis. For statistical analysis in (gI), the two-tailed non-parametric Mann-Whitney test was applied. Data are presented in a box and whisker plot. The box extends from the 25th to the 75th percentile, and the line in the middle is plotted at the median. The whiskers represent the 10–90 percentiles. All data points outside the 10–90 percentile are shown. Statistical analysis and plotting were performed in Prism 10 for MacOS. The Skillings-Mack test was performed in R using the PMCMR plus package (v1.9.10). All the individual numbers used for box plot generation are presented in Table 2 and Supplementary Table 4. Abbreviations: BL = baseline; w = week; IF = infant vaccine schedule group; NE = neonatal vaccine schedule group; PB = placebo group.
Fig. 6
Fig. 6. Principal Component Analysis (PCA) at study timepoints (age groups) in the RV3-BB Malawi and Indonesia study cohorts.
a Describes the PCA of all 355 Malawi samples in the combined treatment group and further separated by neonatal and infant groups. b Describes the PCA of all 478 Indonesia samples in the combined treatment group and further separated by neonatal, placebo, and infant groups. Supplementary Fig. 4 presents the same data with a biplot overlay to illustrate the key taxa responsible for the observed cluster separation. The PCA was performed using the Palaeontological Statistic software package for training and data analysis (v PAST 4.04) with 9999 permutations on Total Sum Scaling (TSS)-transformed data. The confidence ellipse was plotted at 50%. The table inserted in Fig. 6 presents the PCA loading values for all taxa from the all-sample cohort analysis, with a minimum positive value of 0.1 and a minimum negative value of − 0.1. A PCA loading value is equivalent to the coefficients of the taxa and provides information regarding the taxa that contribute the most to the components and, hence, the separation of the individual clusters. Loadings range from − 1 to 1. A high absolute value (towards 1 or − 1) indicates that the variable strongly influences the component, in our case age separation.
Fig. 7
Fig. 7. Most abundant bacterial taxa significantly associated with the RV3-BB vaccine outcome (Malawi and Indonesia) and Rotarix vaccine outcome (Malawi and India).
The MaAsLin2-generated coefficient values from the most abundant bacterial taxa associated with vaccine outcome in the RV3-BB Malawi and Indonesia  cohorts are shown in (a and b), respectively. The coefficient values from the most abundant bacterial taxa associated with vaccine outcome in the re-analysed Rotarix India and Malawi study cohorts are shown in (c and d), respectively. Figure 7 depicts all taxa with a minimum abundance of 1% and a coefficient value within the range of ± 1.5. The figure was generated using GraphPad Prism 10 (v10.2.1) and MAC Keynote (v13.1).
Fig. 8
Fig. 8. Bacterial taxa differences between Rotarix and RV3-BB Studies conducted in Malawi presented according to key study timepoints.
Timepoint comparisons: Rotarix (RX) week 1 (w1) was compared to RV3-BB (RV3) baseline (BL), Rotarix week 6 (w6: dose 1) was compared to RV3-BB week 6 (w6: dose 2), and Rotarix week 10 (w10: dose 2) was compared to RV3-BB week 10 (w10: dose 4*: 3 doses of RV3-BB + 1 dose of placebo). In addition, the adjusted P-values for the following comparisons of interest between the first and last time points for each cohort (i.e., Rotarix week 1 versus week 10 and RV3-BB baseline versus week 10) are also shown. This analysis shows the similarities and differences for the nine most abundant and/or implicated taxa (a Bacteroides, b Bifidobacterium, c Strepotococcus, d Veillonella, e Staphylococcus, f Escherichia, g Enterobacter, h Enterobacteriaceae, i Enterococcus). Statistical analysis was conducted using the Kruskal-Wallis test to determine significant differences in mean rank, along with Dunn’s multiple comparisons test. The error bars show the mean with SD. The plotting and statistical analysis were performed using GraphPad Prism 10 for macOS (v10.2.0). The number of samples in the different time groups were: RX week 1 n = 81, RX week 6 n = 66, RX week 10 n = 61, RV3 baseline n = 59, RV3 week 6 n = 130, RV3 week 10 n = 119.

References

    1. Burnett, E., Parashar, U. D. & Tate, J. E. Real-world effectiveness of rotavirus vaccines, 2006-19: a literature review and meta-analysis. Lancet Glob Health8, e1195–e1202 (2020). - PMC - PubMed
    1. International Vaccine Access Center (IVAC). Vaccine Information Management System (VIMS) global rotavirus vaccine access report. Baltimore: John Hopkins Bloomberg School of Public Health. https://view-hub.org/vaccine/rota (2024).
    1. Du, Y. et al. Global burden and trends of rotavirus infection-associated deaths from 1990 to 2019: an observational trend study. Virol. J.19, 166 (2022). - PMC - PubMed
    1. O’Ryan, M. Rotavirus Vaccines: a story of success with challenges ahead. F1000Res.6, 1517 (2017). - PMC - PubMed
    1. Armah, G. E. et al. Efficacy of pentavalent rotavirus vaccine against severe rotavirus gastroenteritis in infants in developing countries in sub-Saharan Africa: a randomised, double-blind, placebo-controlled trial. Lancet376, 606–614 (2010). - PubMed

Publication types

MeSH terms

Grants and funding