

Frequency-band specific directed connectivity networks reveal functional disruptions and pathogenic patterns in temporal lobe epilepsy: a MEG study
- PMID: 40210922
- PMCID: PMC11985499
- DOI: 10.1038/s41598-025-90299-3
Frequency-band specific directed connectivity networks reveal functional disruptions and pathogenic patterns in temporal lobe epilepsy: a MEG study
Abstract
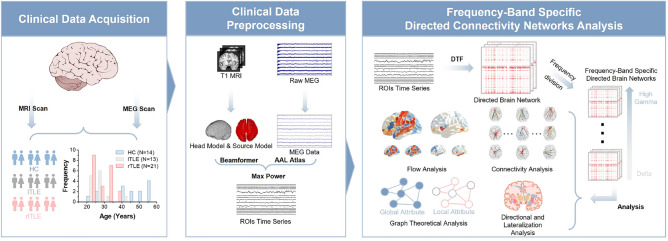
This study investigates the network mechanisms of temporal lobe epilepsy (TLE) using MEG data, focusing on directed connectivity networks across different frequency bands. Unlike previous studies that primarily localize epileptogenic zones, this research aims to explore whole-brain network differences between left TLE (lTLE), right TLE (rTLE), and healthy controls (HCs). MEG data from 13 lTLE patients, 21 rTLE patients, and 14 HCs were source-reconstructed to 116 brain regions (AAL116). Directed Transfer Function (DTF) was used to construct directed connectivity networks, followed by networks and graph-theoretical analyses. The results indicate that, compared to HCs, TLE subjects exhibited a significant increase in average connectivity strength in the Low Gamma band. The connectivity patterns across frequency bands in TLE patients were found to be unstable. Both HC and TLE subjects demonstrated left hemisphere lateralization. In the mid-to-low frequency bands, TLE subjects showed increases in global clustering coefficient (GCC), global characteristic path length (GCPL), and local efficiency (LE) compared to HCs, which is attributed to enhanced synchronization between local brain regions in TLE subjects.
Keywords: Directed transfer function analysis; Graph theoretical analysis; MEG; Temporal lobe epilepsy.
© 2025. The Author(s).
Conflict of interest statement
Declarations. Competing interests: The authors declare no competing interests.
Figures


Similar articles
-
Altered Directed-Connectivity Network in Temporal Lobe Epilepsy: A MEG Study.Sensors (Basel). 2025 Feb 22;25(5):1356. doi: 10.3390/s25051356. Sensors (Basel). 2025. PMID: 40096174 Free PMC article.
-
Aberrant topological patterns of brain structural network in temporal lobe epilepsy.Epilepsia. 2015 Dec;56(12):1992-2002. doi: 10.1111/epi.13225. Epub 2015 Nov 4. Epilepsia. 2015. PMID: 26530395
-
Resting-State Network Transitions in Temporal Lobe Epilepsy: Insights From MEG-Based Dynamic Functional Connectivity.IEEE Trans Neural Syst Rehabil Eng. 2025;33:2286-2298. doi: 10.1109/TNSRE.2025.3576108. IEEE Trans Neural Syst Rehabil Eng. 2025. PMID: 40460015
-
Graph theory findings in the pathophysiology of temporal lobe epilepsy.Clin Neurophysiol. 2014 Jul;125(7):1295-305. doi: 10.1016/j.clinph.2014.04.004. Epub 2014 Apr 21. Clin Neurophysiol. 2014. PMID: 24831083 Free PMC article. Review.
-
Clinical correlates of graph theory findings in temporal lobe epilepsy.Seizure. 2014 Nov;23(10):809-18. doi: 10.1016/j.seizure.2014.07.004. Epub 2014 Jul 23. Seizure. 2014. PMID: 25127370 Free PMC article. Review.
References
-
- Girardi-Schappo, M. et al. Altered communication dynamics reflect cognitive deficits in temporal lobe epilepsy. Epilepsia62, 1022–1033. 10.1111/epi.16864 (2021). - PubMed
-
- Richardson, M. P. Large scale brain models of epilepsy: Dynamics meets connectomics. J. Neurol. Neurosurg. Psychiatry83, 1238–1248. 10.1136/jnnp-2011-301944 (2012). - PubMed
MeSH terms
Grants and funding
LinkOut - more resources
Full Text Sources
