. 2025 Apr 10;12(1):598.
doi: 10.1038/s41597-025-04946-5.

Epigenomic signatures of cis-regulatory elements in the developing mouse and pig forelimb

Affiliations

Epigenomic signatures of cis-regulatory elements in the developing mouse and pig forelimb

Ismael Sospedra-Arrufat et al. Sci Data. .

Abstract

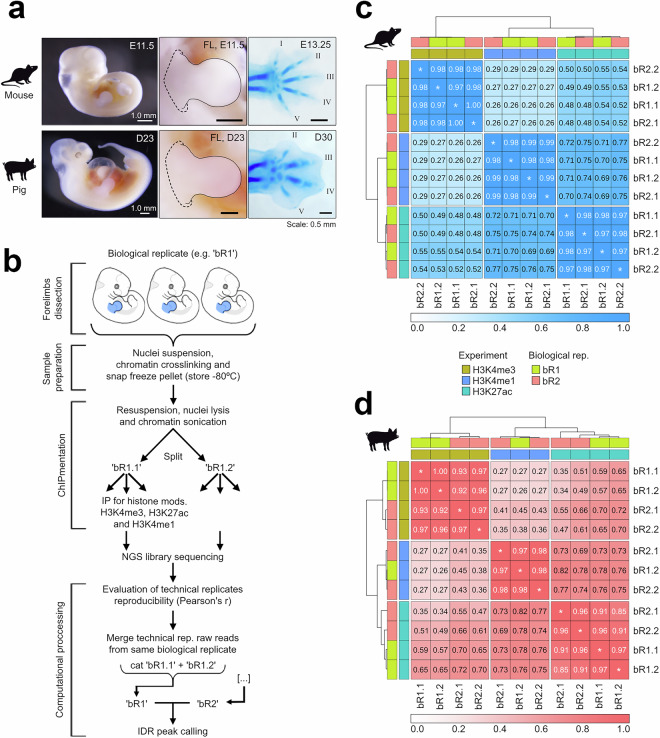
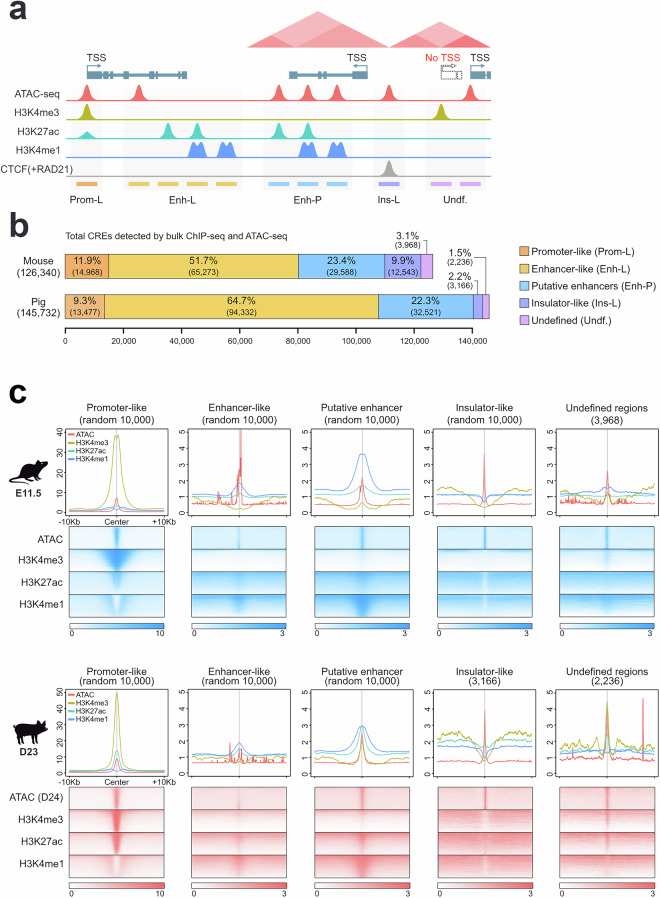
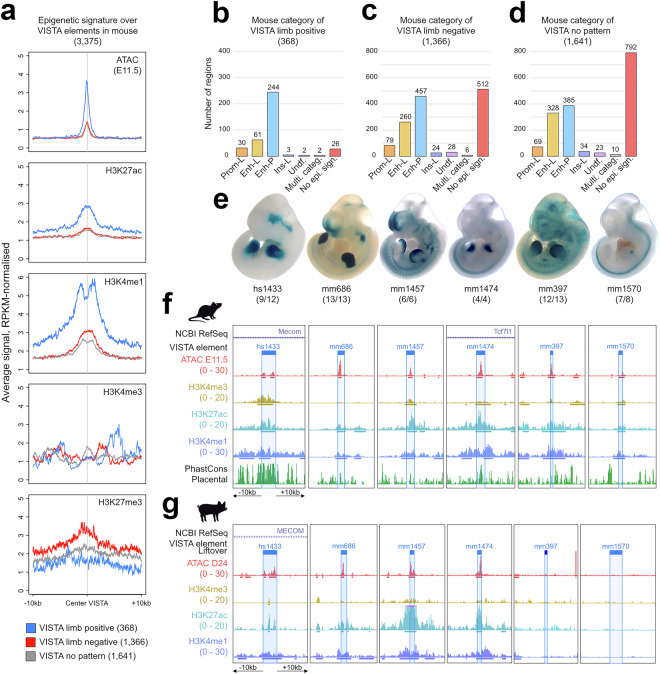
Cis-regulatory elements (CREs) orchestrate the spatiotemporal regulation of key transcriptional programs. These genomic regions-including promoters, enhancers, and insulators-play a crucial role during embryonic development, and their functional diversification is thought to contribute significantly to the morphological evolution of animal body plans. We performed chromatin immunoprecipitation for various histone modifications (H3K4me3, H3K27ac, and H3K4me1) from equivalent developmental stages of mouse (E11.5) and pig (day 23; D23) to identify active regulatory regions during forelimb development in both species. The overlap of these epigenomic signatures with the pattern of open chromatin allowed us to classify these putative regulatory regions into different chromatin states in mouse and pig limb primordia. Our profiling of the regulatory genome in mouse and pig limb buds offers a valuable resource in the evo-devo field for exploring mechanisms underlying the morphological evolution of the tetrapod limb.


Conflict of interest statement

Competing interests: The authors declare no competing interests.

Figures

Fig. 1
Fig. 1
Experimental design and evaluation of data quality. (a) Embryonic stages in mouse (E11.5; top) and pig (D23; bottom) utilized in this study. Middle panels show a close-up of the forelimb, with a dashed line indicating the dissection boundaries for tissue collection. Right panels correspond to Alcian blue-stained limb primordia at later developmental stages to illustrate major morphological differences between mouse and pig handplates. (b) Experimental workflow for ChIP-seq experiments, indicating the processing of technical and biological replicates (see ‘Methods: Sample collection for ChIP-seq’). (c,d) Pearson’s correlation heatmaps of normalized (RPKM) bigWig files for each technical replicate produced in mouse (c) and pig (d). The pig H3K4me1 bR1.1 replicate was discarded due to library poor DNA concentration, and thus not included in this study (Table 1). An asterisk marks the grid positions where each sample is compared to itself.
Fig. 2
Fig. 2
Categorization of cis-regulatory elements (CREs) discovered by bulk ChIP-seq and ATAC-seq in mouse and pig embryonic limbs. (a) Graphic representation of the strategy followed to categorize discovered regions. The most prevalent combinations of epigenomic signatures per category are depicted (see ‘Methods: Criteria to define regions’). (b) Fraction occupied by each category on the total number of CREs detected. A total of 126,340 regions were detected in mouse and 145,732 in pig limb buds. Absolute numbers for each category are depicted in brackets, under the percentage. (c) Plot profiles and feature mid-point heatmaps of histone modifications and chromatin accessibility over the distinct categories identified in mouse (above) and pig (below). For each category, 10,000 randomly selected regions were plotted, except for mouse undefined (3,968), pig insulator-like (3,166), and pig undefined (2,236), where all regions were included. All forelimb datasets shown are E11.5 for mouse and D23 for pig, except for pig ATAC-seq, which had been generated at D24. Plotted signal corresponds to average (10 bp bins) RPKM-normalized data. Regions are centred at the mid-point within a 10 Kb window.
Fig. 3
Fig. 3
Validation of ChIP-seq datasets using assayed VISTA enhancers. (a) Plot profiles for ChIP-seq data generated in this study and a published ATAC and H3K27me3 datasets, in E11.5 mouse forelimbs. The 3,375 tested VISTA elements were classified as: VISTA limb positive (368 elements, blue line), VISTA limb negatives (1,366 elements, red line, representing elements active in tissues other than the limb), and VISTA no pattern (1,641 elements, grey line), indicating no reproducible lacZ pattern in any tissue across at least three tested transgenics. VISTA limb positive elements exhibit higher average signals for ATAC, H3K27ac, and H3K4me1 compared to the VISTA limb negative and no pattern groups. The repressive H3K27me3 mark is more pronounced in the VISTA limb negative category. Plotted signal corresponds to average (10 bp bins) RPKM-normalized data. VISTA-tested regions are centred at the mid-point, flanked by 10 Kb upstream and downstream. (c,d) Distribution of VISTA-assayed elements across functional categories of limb CREs. The VISTA limb positive group (b) was primarily identified as putative enhancers (Enh-P), with only 26 elements remaining undetected and showing no epigenomic signature (No epi. sign.). The number of undetected elements increases in the VISTA limb negative (c) and no pattern (d) groups. ‘Multi. categ.’ (multiple categories) refers to VISTA elements overlapping two or more mouse regions belonging to different functional categories. (e) Examples of the expression of reporter lacZ constructs under the control of VISTA limb positive elements in transgenic E11.5 mouse embryos. The reproducibility of the staining pattern in the limb is indicated below each picture (e.g., hs1433 showed reproducible reporter signal in the limb bud in 9 out of 12 embryos). (f,g) UCSC Genome Browser view in mouse (f) and the corresponding LiftOver region in pig (g) for the VISTA elements shown in (e). Blue boxes highlight the VISTA element within its surrounding landscape, extending 10 Kb upstream and downstream. Tracks display bigWig files for ATAC (E11.5 in mouse and D24 in pig), H3K4me3, H3K27ac, and H3K4me1, with normalized RPKM data. Track scale is indicated in brackets. An equal color bar under each track indicates the IDR-called peaks. The NCBI RefSeq tracks show annotated genes (if any) within the displayed view in both species. Panel (f) also includes the mouse UCSC placental conservation PhastCons track, shown in green. Note that two of the shown VISTA limb positive elements (mm397 and mm1570) are evolutionarily conserved in the pig genome, but, in contrast to mouse, they have lost epigenomic features of enhancers in pig limb bud cells.

Similar articles

References

    1. Liu, X. et al. Cis-Regulatory Elements in Mammals. Int J Mol Sci25, 10.3390/ijms25010343 (2023). - PMC - PubMed
    1. Preissl, S., Gaulton, K. J. & Ren, B. Characterizing cis-regulatory elements using single-cell epigenomics. Nat. Rev. Genet.24, 21–43, 10.1038/s41576-022-00509-1 (2023). - PMC - PubMed
    1. Batut, P. J. et al. Genome organization controls transcriptional dynamics during development. Science375, 566–570, 10.1126/science.abi7178 (2022). - PMC - PubMed
    1. Chen, D. & Lei, E. P. Function and regulation of chromatin insulators in dynamic genome organization. Curr. Opin. Cell Biol.58, 61–68, 10.1016/j.ceb.2019.02.001 (2019). - PMC - PubMed
    1. Segert, J. A., Gisselbrecht, S. S. & Bulyk, M. L. Transcriptional Silencers: Driving Gene Expression with the Brakes On. Trends Genet.37, 514–527, 10.1016/j.tig.2021.02.002 (2021). - PMC - PubMed

LinkOut - more resources