

Identifying commonalities and differences between EHR representations of PASC and ME/CFS in the RECOVER EHR cohort
- PMID: 40210986
- PMCID: PMC11986062
- DOI: 10.1038/s43856-025-00827-5
Identifying commonalities and differences between EHR representations of PASC and ME/CFS in the RECOVER EHR cohort
Abstract
Background: Shared symptoms and biological abnormalities between post-acute sequelae of SARS-CoV-2 infection (PASC) and myalgic encephalomyelitis/chronic fatigue syndrome (ME/CFS) could suggest common pathophysiological bases and would support coordinated treatment efforts. Empirical studies comparing these syndromes are needed to better understand their commonalities and differences.
Methods: We analyzed electronic health record data from 6.5 million adult patients from the National COVID Cohort Collaborative. PASC and ME/CFS diagnostic groups were defined based on recorded diagnoses, and other recorded conditions within the two groups were used to train separate machine learning-driven computable phenotypes (CPs). The most predictive conditions for each CP were examined and compared, and the overlap of patients labeled by each CP was examined. Condition records from the diagnostic groups were also used to statistically derive condition clusters. Rates of subphenotypes based on these clusters were compared between PASC and ME/CFS groups.
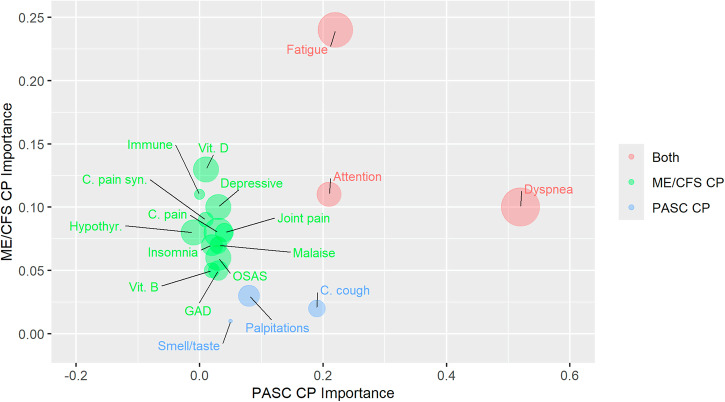
Results: Approximately half of patients labeled by one CP are also labeled by the other. Dyspnea, fatigue, and cognitive impairment are the most-predictive conditions shared by both CPs, whereas other most-predictive conditions are specific to one CP. Recorded conditions separate into cardiopulmonary, neurological, and comorbidity clusters, with the cardiopulmonary cluster showing partial specificity for the PASC groups.
Conclusions: Data-driven approaches indicate substantial overlap in the condition records associated with PASC and ME/CFS diagnoses. Nevertheless, cardiopulmonary conditions are somewhat more commonly associated with PASC diagnosis, whereas other conditions, such as pain and sleep disturbances, are more associated with ME/CFS diagnosis. These findings suggest that symptom management approaches to these illnesses could overlap.
Plain language summary
Post-acute sequelae of SARS-CoV-2 infection (PASC; also known as Long COVID) and myalgic encephalomyelitis/chronic fatigue syndrome (ME/CFS) appear to share much in common. Understanding their similarities and differences could help to guide treatment for these complex illnesses. We analyzed data from 6.5 million adult patients from the National COVID Cohort Collaborative to evaluate patterns in their health records. We find several conditions associated with both PASC and ME/CFS diagnoses, such as difficulty breathing, fatigue, and concentration difficulties. We also find some differences. Cardiac and respiratory conditions are more typical with PASC diagnoses. Records of pain, sleep disturbances, and neuropsychiatric conditions more commonly accompany ME/CFS diagnoses. Overall, the similarities we see could support overlapping symptom management approaches across these illnesses.
© 2025. The Author(s).
Conflict of interest statement
Competing Interests: The authors declare the following competing interests: M Haendel reports status as a founder of Alamya Health. All remaining authors declare no competing interests.
Figures


References
-
- Briggs, N. C. & Levine, P. H. A comparative review of systemic and neurological symptomatology in 12 outbreaks collectively described as chronic fatigue syndrome, epidemic neuromyasthenia, and myalgic encephalomyelitis. Clin. Infect. Dis.18, S32–S42 (1994). - PubMed
-
- Choutka, J., Jansari, V., Hornig, M. & Iwasaki, A. Unexplained post-acute infection syndromes. Nat. Med.28, 911–923 (2022). - PubMed
-
- CDC. Long COVID or post-COVID conditions. Centers for Disease Control and Preventionhttps://www.cdc.gov/coronavirus/2019-ncov/long-term-effects/index.html (2023).
Grants and funding
- U54 GM104938/GM/NIGMS NIH HHS/United States
- UL1 TR002649/TR/NCATS NIH HHS/United States
- UL1 TR002548/TR/NCATS NIH HHS/United States
- UL1 TR001433/TR/NCATS NIH HHS/United States
- UL1 TR001422/TR/NCATS NIH HHS/United States
- UL1 TR001860/TR/NCATS NIH HHS/United States
- UL1 TR001427/TR/NCATS NIH HHS/United States
- U54 GM104942/GM/NIGMS NIH HHS/United States
- UL1 TR001439/TR/NCATS NIH HHS/United States
- UL1 TR002243/TR/NCATS NIH HHS/United States
- UL1 TR001445/TR/NCATS NIH HHS/United States
- UL1 TR003096/TR/NCATS NIH HHS/United States
- UL1 TR002537/TR/NCATS NIH HHS/United States
- UL1 TR001857/TR/NCATS NIH HHS/United States
- UL1 TR001412/TR/NCATS NIH HHS/United States
- U54 GM133807/GM/NIGMS NIH HHS/United States
- UL1 TR001872/TR/NCATS NIH HHS/United States
- UL1 TR001878/TR/NCATS NIH HHS/United States
- UL1 TR002529/TR/NCATS NIH HHS/United States
- UL1 TR001863/TR/NCATS NIH HHS/United States
- UL1 TR002494/TR/NCATS NIH HHS/United States
- UL1 TR002736/TR/NCATS NIH HHS/United States
- U54 GM115516/GM/NIGMS NIH HHS/United States
- UL1 TR002369/TR/NCATS NIH HHS/United States
- UL1 TR002541/TR/NCATS NIH HHS/United States
- U54 GM115371/GM/NIGMS NIH HHS/United States
- UL1 TR002001/TR/NCATS NIH HHS/United States
- UL1 TR002538/TR/NCATS NIH HHS/United States
- UM1 TR004406/TR/NCATS NIH HHS/United States
- U54 GM115458/GM/NIGMS NIH HHS/United States
- UL1 TR001442/TR/NCATS NIH HHS/United States
- UL1 TR002535/TR/NCATS NIH HHS/United States
- UL1 TR001866/TR/NCATS NIH HHS/United States
- UL1 TR003167/TR/NCATS NIH HHS/United States
- OT2 HL161847/HL/NHLBI NIH HHS/United States
- UL1 TR001409/TR/NCATS NIH HHS/United States
- UL1 TR001449/TR/NCATS NIH HHS/United States
- UL1 TR001453/TR/NCATS NIH HHS/United States
- UL1 TR002489/TR/NCATS NIH HHS/United States
- U54 GM104940/GM/NIGMS NIH HHS/United States
- UL1 TR003107/TR/NCATS NIH HHS/United States
- INV-018455/GATES/Gates Foundation/United States
- UL1 TR003015/TR/NCATS NIH HHS/United States
- UL1 TR002733/TR/NCATS NIH HHS/United States
- UL1 TR001420/TR/NCATS NIH HHS/United States
- UM1 TR005121/TR/NCATS NIH HHS/United States
- U24 TR002306/TR/NCATS NIH HHS/United States
- UL1 TR002003/TR/NCATS NIH HHS/United States
- UL1 TR001876/TR/NCATS NIH HHS/United States
- UL1 TR001436/TR/NCATS NIH HHS/United States
- UL1 TR002378/TR/NCATS NIH HHS/United States
- UL1 TR002384/TR/NCATS NIH HHS/United States
- UL1 TR002553/TR/NCATS NIH HHS/United States
- UL1 TR002389/TR/NCATS NIH HHS/United States
- UL1 TR001414/TR/NCATS NIH HHS/United States
- U54 GM104941/GM/NIGMS NIH HHS/United States
- UL1 TR002014/TR/NCATS NIH HHS/United States
- UM1 TR004528/TR/NCATS NIH HHS/United States
- UL1 TR002550/TR/NCATS NIH HHS/United States
- UL1 TR002319/TR/NCATS NIH HHS/United States
- UL1 TR001855/TR/NCATS NIH HHS/United States
- UL1 TR001425/TR/NCATS NIH HHS/United States
- UL1 TR002373/TR/NCATS NIH HHS/United States
- UL1 TR002240/TR/NCATS NIH HHS/United States
- UL1 TR002556/TR/NCATS NIH HHS/United States
- UL1 TR003017/TR/NCATS NIH HHS/United States
- UL1 TR001998/TR/NCATS NIH HHS/United States
- UL1 TR001873/TR/NCATS NIH HHS/United States
- UL1 TR001881/TR/NCATS NIH HHS/United States
- UL1 TR002645/TR/NCATS NIH HHS/United States
- UL1 TR001450/TR/NCATS NIH HHS/United States
- UL1 TR002366/TR/NCATS NIH HHS/United States
- U54 GM115428/GM/NIGMS NIH HHS/United States
- UL1 TR002345/TR/NCATS NIH HHS/United States
- UL1 TR002377/TR/NCATS NIH HHS/United States
- U54 GM115677/GM/NIGMS NIH HHS/United States
- UL1 TR002544/TR/NCATS NIH HHS/United States
- UL1 TR003098/TR/NCATS NIH HHS/United States
- UL1 TR001430/TR/NCATS NIH HHS/United States
- UL1 TR003142/TR/NCATS NIH HHS/United States
LinkOut - more resources
Full Text Sources
Miscellaneous
