. 2025 May;22(5):950-961.
doi: 10.1038/s41592-025-02652-z. Epub 2025 Apr 10.

Perturb-tracing enables high-content screening of multi-scale 3D genome regulators

Affiliations

Perturb-tracing enables high-content screening of multi-scale 3D genome regulators

Yubao Cheng et al. Nat Methods. 2025 May.

Abstract

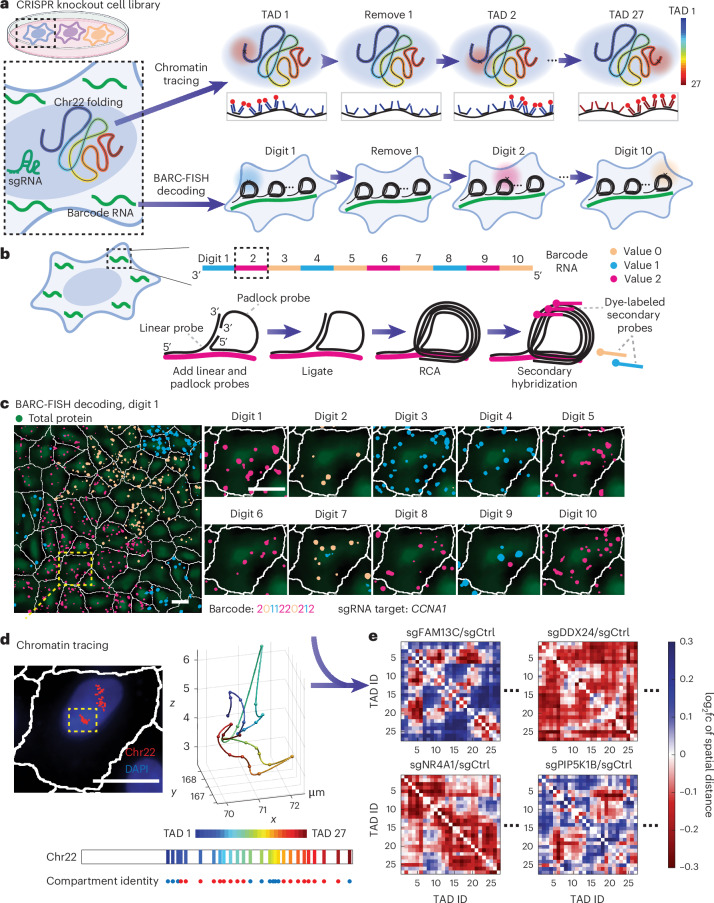
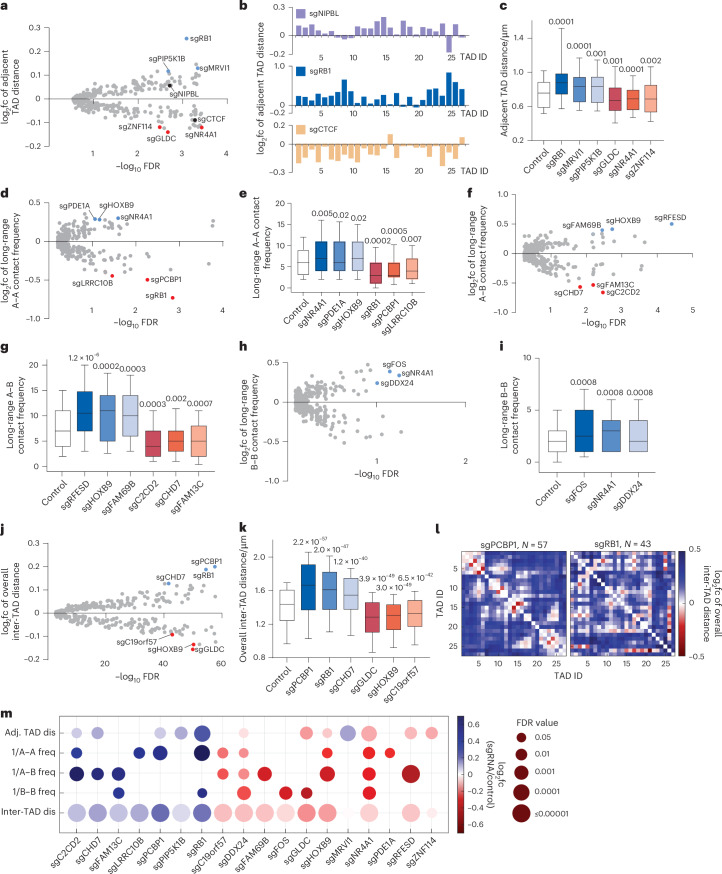
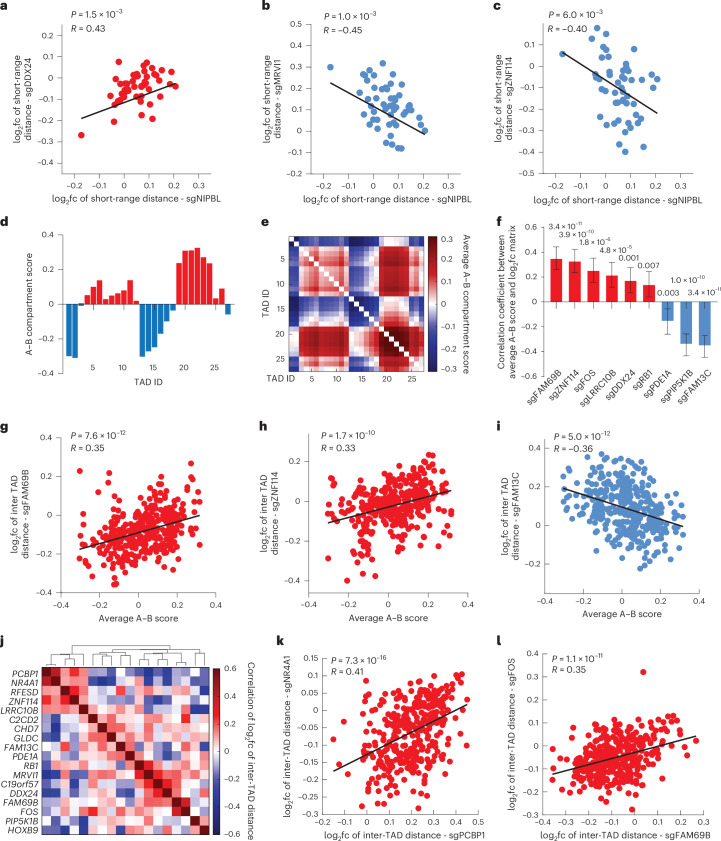
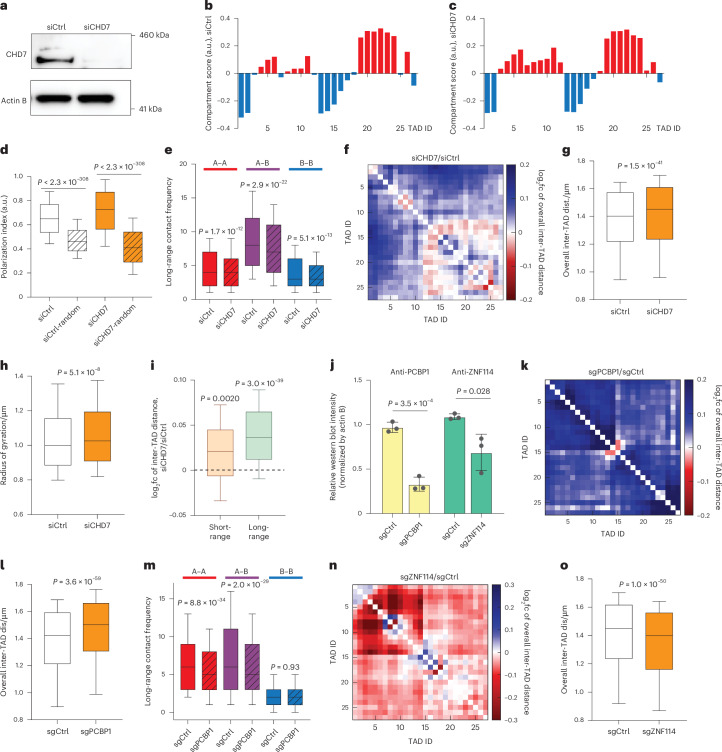
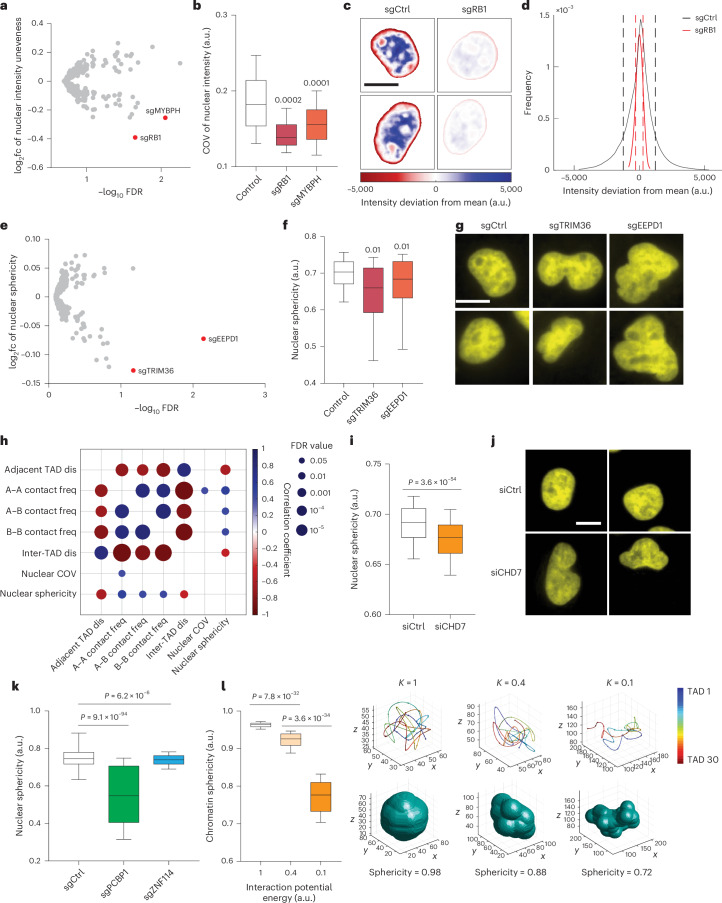
Three-dimensional (3D) genome organization becomes altered during development, aging and disease, but the factors regulating chromatin topology are incompletely understood and currently no technology can efficiently screen for new regulators of multi-scale chromatin organization. Here, we developed an image-based high-content screening platform (Perturb-tracing) that combines pooled CRISPR screens, a cellular barcode readout method (BARC-FISH) and chromatin tracing. We performed a loss-of-function screen in human cells, and visualized alterations to their 3D chromatin folding conformations, alongside perturbation-paired barcode readout in the same single cells. We discovered tens of new regulators of chromatin folding at different length scales, ranging from chromatin domains and compartments to chromosome territory. A subset of the regulators exhibited 3D genome effects associated with loop extrusion and A-B compartmentalization mechanisms, while others were largely unrelated to these known 3D genome mechanisms. Finally, we identified new regulators of nuclear architectures and found a functional link between chromatin compaction and nuclear shape. Altogether, our method enables scalable, high-content identification of chromatin and nuclear topology regulators that will stimulate new insights into the 3D genome.


Conflict of interest statement

Competing interests: S.W., B.Y. and M.H. are inventors on a patent applied for by Yale University related to this work. The other authors declare no competing interests.

Figures

Fig. 1
Fig. 1. Perturb-tracing enables image-based pooled CRISPR screen of chromatin and nuclear organization regulators.
a, Schematic of the screening approach. For chromatin tracing, all 27 TADs spanning chr22 were sequentially visualized in a multiplexed DNA FISH procedure. For BARC-FISH decoding, ten digits of the barcode were amplified and sequentially imaged. b, A scheme of the BARC-FISH method. The expressed barcode RNA was composed of ten ‘digits’, and each digit had one of three different values (values 0, 1 and 2, represented by orange, cyan and magenta, respectively). c, An example of BARC-FISH decoding from one of 17 replicate datasets. A representative field of view (left image) from the screen with BARC-FISH signals shown in orange, cyan and magenta; cell segmentation shown as white lines; and total protein stain in green. The right boxes depict magnifcations of the yellow box in the left image in ten rounds of decoding. Scale bars, 20 µm. d, Chromatin tracing of the yellow-boxed cell in c. Left, an image of the cell, with the traces of three copies of chr22 shown in red and DAPI stain shown in blue. Right, 3D chromatin trace of the chromosome in the yellow box in the left image. The 3D positions of each TAD are shown as pseudo-colored spots, connected with a smooth curve. Below, The genomic positions of TADs 1–27 on chr22, and their corresponding compartment identity (red, compartment A; blue, compartment B). Scale bar, 20 µm. e, Example matrices of log2 fold changes of inter-TAD spatial distances for selected hits from the screen.
Fig. 2
Fig. 2. Perturb-tracing screen identified regulators of multi-scale chromatin folding.
a, log2 fold change (log2fc) of spatial distance between adjacent TADs versus −log10 false discovery rate (FDR) for each perturbation. In all volcano plots, top nuclear protein hits (largest log2fc, FDR < 0.1) are marked: blue indicates upregulation and red indicates downregulation after knockout. b, log2fc of adjacent TAD distances across chr22 for selected hits. c, Spatial distances between adjacent TADs for control and selected hits. Number of traces analyzed: 57286, 43, 116, 87, 40, 129 and 42 (left to right). d, log2fc of long-range A–A contact frequency versus −log10 FDR for each perturbation. e, Long-range A–A contact frequencies for control and selected hits. Number of traces analyzed: 57286, 129, 103, 65, 43, 57 and 54 (left to right). f, log2fc of long-range A–B contact frequency versus −log10 FDR for each perturbation. g, Long-range A–B contact frequencies for control and selected hits. Number of traces analyzed: 57286, 92, 65, 50, 49, 41 and 53 (left to right). h, log2fc of long-range B–B contact frequency versus −log10 FDR for each perturbation. i, Long-range B–B contact frequencies for control and selected hits. Number of traces analyzed: 57286, 124, 129 and 213 (left to right). j, log2fc of overall inter-TAD distances versus −log10 FDR for each perturbation. k, Overall inter-TAD distances for control and selected hits. Number of traces analyzed: 57286, 57, 276, 41, 40, 65 and 61 (left to right). l, log2fc of overall inter-TAD distances in chr22 for selected hits. m, Fold change (circle color) and significance (circle size) of multi-scale chromatin folding phenotypes of top hits. Phenotypic changes with FDR > 0.05 are not shown. P values in c and k were calculated by two-sided Wilcoxon signed-rank test with FDR correction. P values in e, g and i were calculated by two-sided Wilcoxon rank-sum test with FDR correction. The boxes cover the 25th to 75th percentiles, the whiskers cover the 10th to 90th percentiles, and the lines in the middle of the boxes represent the median values.
Fig. 3
Fig. 3. Characterization of the regulators of multi-scale chromatin folding.
ac, Correlation of log2fc of short-range inter-TAD distances (defined as spatial distances between genomic regions that are less than 3 Mb apart) between sgNIPBL and sgDDX24 (a), sgMRVI1 (b) or sgZNF114 (c). d, A–B compartment score profile of chr22. e, Matrix of average A–B compartment scores of pairs of TADs. f, Top hits with 3D genome effects (log2fc of inter-TAD distance upon knockout) significantly correlated with the A–B compartment score matrix. Number of traces analyzed: 50, 42, 124, 54, 213, 43, 103, 87 and 53 (left to right). Correlations were derived from 351 data points. Data are presented as correlation coefficients with 95% confidence intervals as error bars. gi, Correlation between the average A–B compartment score of the TADs and the log2fc of inter-TAD distances upon FAM69B (g), ZNF114 (h) or FAM13C (i) knockout. j, Hierarchical clustering of correlation coefficients between the log2fc matrices of inter-TAD distances for top hits. k,l, Correlation of the log2fc of inter-TAD distances between sgPCBP1 and sgNR4A1 (k) or between sgFAM69B and sgFOS (l). P values in ac, fi and kl were calculated by two-sided t-test. FDR corrections were applied to f.
Fig. 4
Fig. 4. Individual validations of top hits.
a, Western blot of siCtrl-treated and siCHD7-treated A549-Cas9 nuclear extracts. The experiment was repeated five times with similar results. b, A–B compartment profile of chr22 in siCtrl cells. c, A–B compartment profile of chr22 in siCHD7 cells. d, Polarization indices of chr22 A–B compartments of siCtrl (white) and siCHD7 (orange). Shadowed boxes show the polarization indices from randomized controls, where the compartment identities of TADs are scrambled. e, Compartmental contact frequencies of siCtrl and siCHD7 (shadowed) among A compartment regions (red), between A and B compartment regions (purple) and among B compartment regions (blue). f, log2fc of inter-TAD distance of siCHD7 compared to siCtrl. g, Overall inter-TAD distance of siCtrl and siCHD7. h, Radii of gyration of siCtrl and siCHD7. i, log2fc of short-range and long-range inter-TAD distances between siCHD7 and siCtrl. j, Relative blot intensities of PCBP1 and ZNF114 western blot bands (normalized by loading control actin B bands). Data are presented as mean values ± s.d. Statistics are derived from three biological replicates. k, log2fc of inter-TAD distance of sgPCBP1 compared to sgCtrl. l, Overall inter-TAD distance of sgCtrl and sgPCBP1. m, Compartmental contact frequencies of sgCtrl and sgPCBP1 (shadowed) among A compartment regions (red), between A and B compartment regions (purple) and among B compartment regions (blue). n, log2fc of inter-TAD distance of sgZNF114 compared to sgCtrl. o, Overall inter-TAD distance of sgCtrl and sgZNF114. P values in d, e, h and m were calculated by two-sided Wilcoxon rank-sum test. P values in g, i, l and o were calculated by two-sided Wilcoxon signed-rank test. P value in j was calculated by a two-sided, two-sample t-test. The boxes cover the 25th to 75th percentiles, the whiskers cover the 10th to 90th percentiles, and the lines in the middle of the boxes represent the median values. Number of traces analyzed: 3,181 (siCtrl) and 3,545 (siCHD7) for d and h; 3,558 (siCtrl) and 4,134 (siCHD7) for eg and i; 4,627 (sgCtrl) and 3,543 (sgPCBP1) for km; 4,602 (sgCtrl) and 3,954 (sgZNF114) for n and o. a.u., arbitrary units. Source data
Fig. 5
Fig. 5. Perturb-tracing screen identified hits that regulate the morphological properties of nuclei.
a, log2fc of nuclear intensity unevenness (measured as coefficient of variation (COV) of nuclear voxel intensities) versus −log10 FDR. b, Nuclear intensity unevenness of control and selected hits. Number of cells analyzed: 17304, 12 and 36 (left to right). c, Heat map of nuclear intensity deviation from mean intensity of representative nuclei from non-targeting control (left column) and hit sgRB1 (right column). Scale bar, 10 μm. d, Voxel intensity distribution of all nuclei from non-targeting control (black curve) and hit sgRB1 (red curve). Dashed lines indicate the standard deviations of the distributions. e, log2fc of nuclear sphericity versus −log10 FDR. f, Nuclear sphericity of control and selected hits. Number of cells analyzed: 17304, 14 and 64 (left to right). g, Representative nuclei images of non-targeting control (left column) and selected hits that regulate nuclear sphericity, TRIM36 (middle column) and EEPD1 (right column). Scale bar, 10 μm. h, Correlation coefficients (bubble color) and significance of correlations (bubble size) between pairs of 3D genome/nucleome features calculated using all top hits. i, Nuclear sphericity values of siCtrl and siCHD7 A549-Cas9 Cells. Number of cells analyzed: 1,156 (siCtrl) and 1,412 (siCHD7). j, Representative DAPI images of siCtrl and siCHD7 A549-Cas9 cells. k, Nuclear sphericity values of sgCtrl, sgPCBP1 and sgZNF114 A549-Cas9 Cells. Number of cells analyzed: 2,474 (sgCtrl), 1,395 (sgPCBP1) and 1,367 (sgZNF114). l, Simulated chromatin polymer folding conformations and the corresponding bounding envelop sphericity values at different chromatin self-interaction energies (K = 1, 0.4 or 0.1). Lower energy corresponds to weaker chromatin interaction. N = 100 simulated conformations for each energy. P values in b, f, i, k and l were calculated by two-sided Wilcoxon rank-sum test. P values in h were calculated by two-sided t-tests. FDR correction was applied to b, f and h. The boxes cover the 25th to 75th percentiles, the whiskers cover the 10th to 90th percentiles, and the lines in the middle of the boxes represent the median values.
Extended Data Fig. 1
Extended Data Fig. 1. CRISPR screen library allows for sgRNA expression for genome editing and the barcode RNA expression for BARC-FISH decoding.
a, Schematic of the construction of CRISPR screen library. A CRISPR knockout plasmid library containing sgRNA-barcode associations was constructed to generate a lentivirus library, which was transduced into human A549-Cas9 cells to produce a cell library. b, Design of the CRISPR screen plasmid and the lentiviral integration strategy. The sgRNA-barcode cassette was composed of human U6 promoter (hU6, blue), sgRNA (yellow), barcode (purple) and UMI (dark blue) sequences and placed within 3′ long terminal repeat (3′ LTR, dark gray), downstream of a strong RNA Pol II promoter (CMV, green). This cassette was duplicated and inserted within 5′ LTR (light gray) during lentiviral integration. Therefore, the cassette within 5′ LTR was able to express the sgRNA for genome editing, while the other copy was driven by CMV promoter to express a high level of barcode RNA for BARC-FISH decoding. Other elements on the plasmid including EF-1α promoter (pink), Puromycin resistance gene (magenta) and WPRE element (brown) were shown. c, BARC-FISH decoding efficiency in the CRISPR screen cell library. After BARC-FISH decoding procedure, the decoded barcodes were compared and matched to the barcodes determined by NGS. 33% of the imaged cells contained barcodes with perfect matches. After the error correction, 51% of the cells contained matched barcodes. d, Analysis of barcode quality determined by NGS. The sgRNA-barcode associations in the CRISPR screen cell library were determined by NGS (see Methods, “Detection of sgRNA-barcode associations in the cell library” section). In total, 4,469 barcodes were detected, among which 76% were good codes associating with one unique sgRNA. 413 sgRNAs targeting 137 genes and 8 non-targeting controls were found to be associated with these good codes. 412 of the 413 sgRNAs were observed in the image-based screen.
Extended Data Fig. 2
Extended Data Fig. 2. Cloning strategy of plasmid libraries, CRISPR knockout efficiency, and the Geminin-based cell cycle identification.
a, The barcode plasmid library was assembled from individual oligos through overlapping ligation, overlapping PCR, limited-cycle PCR and Gibson Assembly (see Methods, “Barcode plasmid library construction” section). Each of the forward-strand oligos contained three alternative sequences (in the smaller gray dashed box), represented by three different colors cyan, magenta, and yellow. The overlapping oligos in the reverse strand contained 9 alternative sequences (in the larger gray dashed box). Oligos at the two ends carried PCR priming regions (straight gray lines). The barcode was divided into two halves which were subjected to overlapping ligation to form two double-stranded fragments. The two fragments were assembled by overlapping PCR to form a full-length barcode. The barcode was then amplified and added with UMI (unique molecular identifier) by limited-cycle PCR primers. The barcode-UMI fragments were inserted into a digested plasmid backbone through Gibson Assembly to construct the final barcode plasmid library. To clone the CRISPR screen plasmid library, sgRNA fragments and barcode-UMI fragments were amplified from the premade sgRNA plasmid library and barcode plasmid library respectively, through limited-cycle PCR. The sgRNA and barcode-UMI were then Gibson Assembled into a digested lentiviral plasmid backbone to generate the final CRISPR screen plasmid library (see Methods, “CRISPR screen plasmid library construction” section). The UMI was necessary for sequencing-based mapping of barcode-sgRNA associations (see Methods, “Next-generation sequencing (NGS) library preparation for mapping sgRNA-barcode associations”). b, Percentage of frameshift mutations of sgCHD7, sgTBX6, sgRUNX3, sgNIPBL and sgLRIF1. c, Two representative cells from the screen datasets were shown to demonstrate the Geminin staining strategy for G1 phase cell detection. Geminin antibody stain (magenta) is absent in a G1 phase cell (left), which showed three DNA FISH foci of TAD3 (yellow) of chr22. The S/G2 phase cell (right) is positive for Geminin stain and have six DNA FISH foci of TAD3 in three pairs, indicating replicated TAD3 DNA. Because Geminin and the yellow-green fiducial beads were imaged using the same laser channel, bead patterns were seen in both images (small, round magenta spots outside of the nuclei). Scale bar: 10 μm.
Extended Data Fig. 3
Extended Data Fig. 3. Validation of CHD7 perturbation phenotypes using overexpression.
a, A-B compartment profile of chr22 in A549-Cas9 cells with GFP overexpression. b, A-B compartment profile of chr22 in A549-Cas9 cells with CHD7 overexpression. c, Polarization indices of cells with GFP (white) and CHD7 (orange) overexpression and the corresponding randomized controls (shadowed). Number of traces analyzed: 2,701 (GFP and GFP-random) and 1,015 (CHD7 and CHD7-random). d, Compartmental contact frequencies of cells with GFP of CHD7 (shadowed) overexpression in A compartments (red), across A and B compartments (purple) and in B compartments (blue). Number of traces analyzed: 3,157 (GFP OE) and 1,174 (CHD7 OE). e, Log2 fold change of inter-TAD distance of CHD7 overexpression compared to GFP overexpression. Number of traces analyzed: 3,157 (GFP OE) and 1,174 (CHD7 OE). f, Overall inter-TAD distance of chr22 in cells with GFP and CHD7 overexpression. Number of traces analyzed: 3,157 (GFP OE) and 1,174 (CHD7 OE). g, Radii of gyration of chr22 in cells with GFP and CHD7 overexpression. Number of traces analyzed: 2,701 (GFP OE) and 1,015 (CHD7 OE). h, Log2 fold change of short-range and long-range inter-TAD distances between CHD7 and GFP overexpression. Number of traces analyzed: 3,157 (GFP OE) and 1,174 (CHD7 OE). i, Area of chr22 territories per cell measured by whole chromosome paint in cells with GFP and CHD7 overexpression. Number of cells analyzed: 1,715 (GFP OE) and 1,538 (CHD7 OE). P values in c, d, g and i were calculated by two-sided Wilcoxon rank sum test. P values in f and h were calculated by two-sided Wilcoxon signed rank test. The boxes cover the 25th to 75th percentiles, the whiskers cover the 10th to 90th percentiles, and the lines in the middle of the boxes represent the median values.
Extended Data Fig. 4
Extended Data Fig. 4. Validation of CHD7 perturbation phenotypes in a different cell background and genomic context.
a, Log2 fold change matrix of overall inter-TAD distance of chr21 between siCHD7 and siCtrl in hTERT RPE-1 cells. Number of traces analyzed: 904 (siCtrl) and 210 (siCHD7). b, Overall inter-TAD distance of chr21 in siCtrl and siCHD7 cells. Number of traces analyzed: 904 (siCtrl) and 210 (siCHD7). c, Radii of gyration of chr21 in siCtrl and siCHD7 cells. Number of traces analyzed: 840 (siCtrl) and 178 (siCHD7). d, Log2 fold change of short-range and long-range inter-TAD distances between siCHD7 and siCtrl. Number of traces analyzed: 904 (siCtrl) and 210 (siCHD7). e, Compartmental contact frequencies in A compartments (red), across A and B compartments (purple) and in B compartments (blue) of chr21 in siCtrl and siCHD7 cells. Number of traces analyzed: 904 (siCtrl) and 210 (siCHD7). P values in b and d were calculated by two-sided Wilcoxon signed rank test. P values in c and e were calculated by two-sided Wilcoxon rank sum test. The boxes cover the 25th to 75th percentiles, the whiskers cover the 10th to 90th percentiles, and the lines in the middle of the boxes represent the median values.
Extended Data Fig. 5
Extended Data Fig. 5. Validation of CHD7’s long range chromatin compaction function in neural crest cells.
a, Western blot of shControl- and shCHD7-transduced human embryonic stem cells (hESC) and human neural crest progenitors (hNCP). Top: anti-CHD7 antibody; middle: anti-SOX10 antibody; bottom: anti-HSP90 antibody. CHD7 increased upon neural crest induction, and reduced in shCHD7 hNCP cells compared to shControl. Sox10, the neural crest marker, was expressed at similar levels in shControl and shCHD7 hNCP cells. HSP90 is a loading control. The experiment was repeated twice independently with similar results. b, Log2 fold change of overall inter-TAD distance of chr22 between shCHD7 and shControl hNCP cells. Number of traces analyzed: 4,657 (shControl) and 2,796 (shCHD7). c, Log2 fold change of short-range and long-range inter-TAD distances of chr22 between shCHD7 and shContrl hNCP cells. Number of traces analyzed: 4,657 (shControl) and 2,796 (shCHD7). P values were calculated by two-sided Wilcoxon signed rank test. The boxes cover the 25th to 75th percentiles, the whiskers cover the 10th to 90th percentiles, and the lines in the middle of the boxes represent the median values. Source data
Extended Data Fig. 6
Extended Data Fig. 6. Additional PCBP1 and ZNF114 perturbation results.
a, Western blot of sgCtrl and sgPCBP1 A549-Cas9 nuclear extracts. Top: anti-PCBP1 antibody; bottom: anti-Actin B antibody. The experiment was repeated twice independently with similar results. b, Western blot of sgCtrl and sgZNF114 A549-Cas9 nuclear extracts. Top: anti-ZNF114 antibody; bottom: anti-Actin B antibody. The experiment was repeated twice independently with similar results. c-d, A-B compartment profile of chr22 in sgCtrl (c) and sgPCBP1 (d) A549-Cas9 cells measured in parallel. e, Polarization indices of chr22 A-B compartments of sgCtrl (white) and sgPCBP1 (orange). Shadowed boxes show the polarization indices from randomized controls, where the compartment identities of TADs are scrambled. f-g, A-B compartment profile of chr22 in sgCtrl (f) and sgZNF114 (g) A549-Cas9 cells measured in parallel. h, Polarization indices of chr22 A-B compartments of sgCtrl (white) and sgZNF114 (orange). Shadowed boxes show the polarization indices from randomized controls, where the compartment identities of TADs are scrambled. i, Area of chr22 territories per cell measured by whole chromosome paint in sgCtrl, sgPCBP1 and sgZNF114 A549-Cas9 cells. Number of cells analyzed: 855 (sgCtrl), 320 (sgPCBP1) and 609 (sgZNF114). P values in e, h and i were calculated by two-sided Wilcoxon rank sum test. The boxes cover the 25th to 75th percentiles, the whiskers cover the 10th to 90th percentiles, and the lines in the middle of the boxes represent the median values. Source data
Extended Data Fig. 7
Extended Data Fig. 7. Total contents in different screen methods.
Perturb-tracing: 420 gRNAs multiply 30 phenotypic imaging targets including 27 TADs, DAPI, total protein, and Geminin stains.

Update of

References

    1. Zheng, H. & Xie, W. The role of 3D genome organization in development and cell differentiation. Nat. Rev. Mol. Cell Biol.20, 535–550 (2019). - PubMed
    1. Nora, E. P. et al. Targeted degradation of CTCF decouples local insulation of chromosome domains from genomic compartmentalization. Cell169, 930–944 (2017). - PMC - PubMed
    1. Rao, S. S. P. et al. Cohesin loss eliminates all loop domains. Cell171, 305–320 (2017). - PMC - PubMed
    1. Schwarzer, W. et al. Two independent modes of chromatin organization revealed by cohesin removal. Nature551, 51–56 (2017). - PMC - PubMed
    1. Shachar, S., Voss, T. C., Pegoraro, G., Sciascia, N. & Misteli, T. Identification of gene positioning factors using high-throughput imaging mapping. Cell162, 911–923 (2015). - PMC - PubMed

LinkOut - more resources