. 2025 Jun;17(6):1238-1258.
doi: 10.1038/s44321-025-00233-3. Epub 2025 Apr 10.

SOX9-dependent fibrosis drives renal function in nephronophthisis

Affiliations

SOX9-dependent fibrosis drives renal function in nephronophthisis

Maulin Mukeshchandra Patel et al. EMBO Mol Med. 2025 Jun.

Abstract

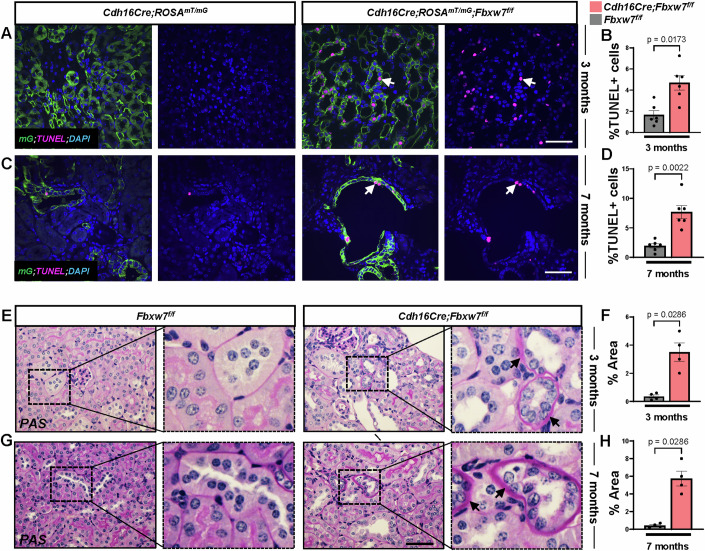
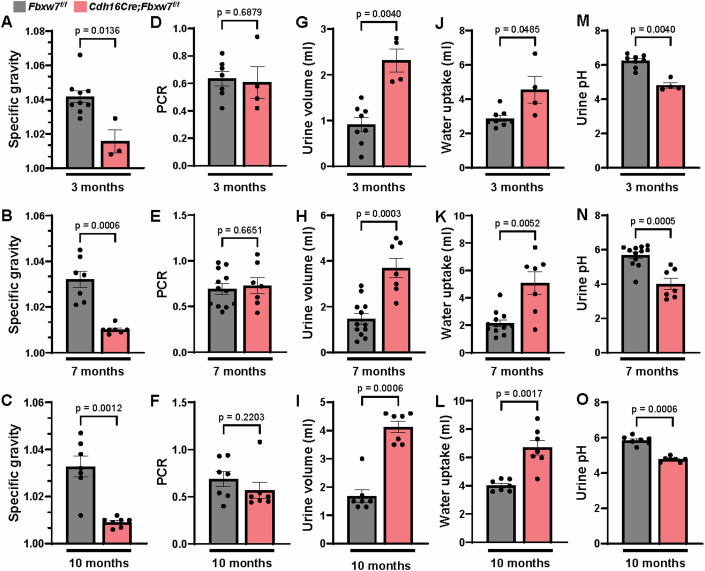
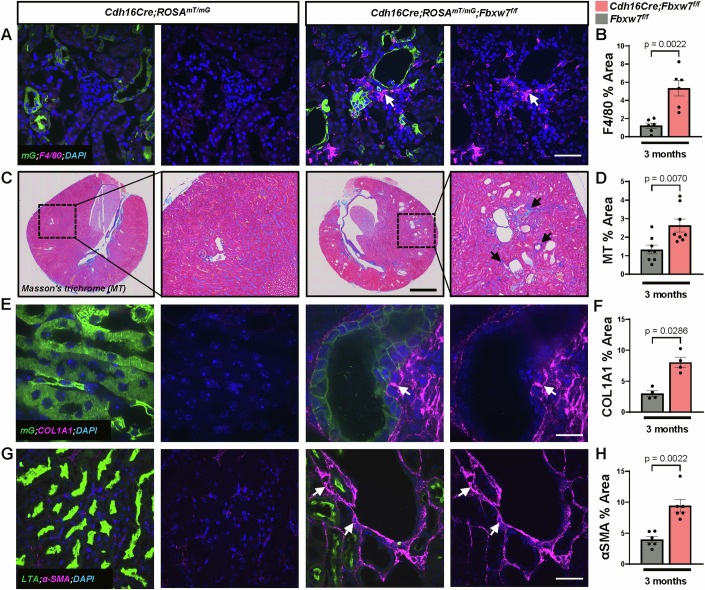
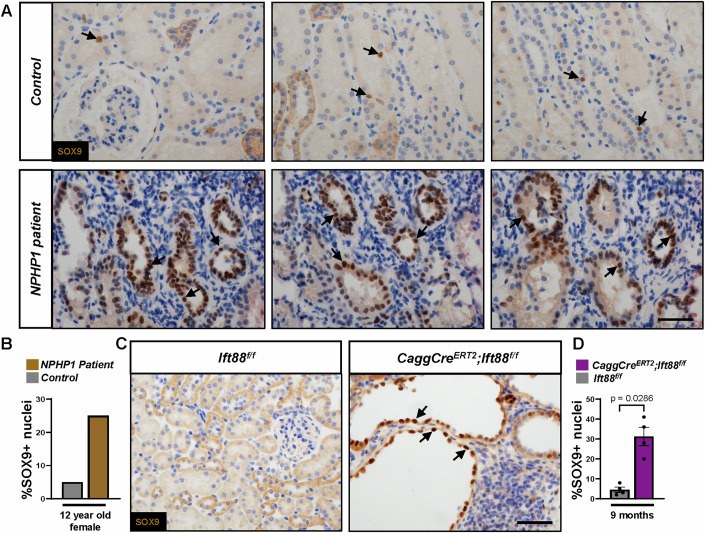
Fibrosis is a key feature of a broad spectrum of cystic kidney diseases, especially autosomal recessive kidney disorders such as nephronophthisis (NPHP). However, its contribution to kidney function decline and the underlying molecular mechanism(s) remains unclear. Here, we show that kidney-specific deletion of Fbxw7, the recognition receptor of the SCFFBW7 E3 ubiquitin ligase, results in a juvenile-adult NPHP-like pathology characterized by slow-progressing corticomedullary cysts, tubular degeneration, severe fibrosis, and gradual loss of kidney function. Expression levels of SOX9, a known substrate of FBW7, and WNT4, a potent pro-fibrotic factor and downstream effector of SOX9, were elevated upon loss of FBW7. Heterozygous deletion of Sox9 in compound mutant mice led to the normalization of WNT4 levels, reduced fibrosis, and preservation of kidney function without significant effects on cystic dilatation and tubular degeneration. These data suggest that FBW7-SOX9-WNT4-induced fibrosis drives kidney function decline in NPHP and, possibly, other forms of autosomal recessive kidney disorders.

Keywords: FBW7; Fibrosis; Kidney Function; Nephronophthisis; SOX9.


Conflict of interest statement

Disclosure and competing interests statement. The authors declare no competing interests.

Figures

Figure 1
Figure 1. Deletion of Fbxw7 results in a slow-progressing cyst and a decline in kidney function.
(A) Representative images of whole kidney section scan showing cyst progression, (B) 2 kidney weight/body weight (2KW/BW) (n ≥ 5) (C) Serum BUN (n ≥ 3), (D) Creatinine (n ≥ 4), and (E) Cytastin C (n ≥ 4) from 1-, 3-, 7-, and 10-month-old Fbxw7f/f and Cdh16Cre;Fbxw7f/f mice. Each data point represents one animal. Statistical analysis was performed using two-way ANOVA and is presented as the mean ± SEM. Scale bar: 400 µm. (F, G) Representative images and quantification of Ki67 staining from 3-month-old kidneys of Cdh16Cre;ROSAmT/mG and Cdh16Cre;ROSAmT/mG;Fbxw7f/f mice. Epithelial cells where Cdh16Cre is active express membrane-targeted GFP. (F) White arrows show Ki67-positive (+) (pink) epithelial cells where Cdh16Cre is active (mG + , green). Yellow arrows show Ki67+ cells where Cdh16Cre is inactive (mG-). Nuclei are stained with DAPI (blue). Scale bar: 50 µm. (G) Each data point represents the mean Ki67 + ;mG+ or Ki67 + ;mG- cells scored per animal (n ≥ 7). Statistical analysis was performed using one-way ANOVA followed by Šídák’s multiple comparisons test and is presented as the mean ± SEM. Source data are available online for this figure.
Figure 2
Figure 2. Loss of FBW7 results in increased cell death and thickening of the tubular basal membrane.
(AD) Representative images of TUNEL staining and quantification from 3- and 7-month-old kidneys of Cdh16Cre;ROSAmT/mG and Cdh16Cre;ROSAmT/mG;Fbxw7f/f mice. (A, C) White arrows show TUNEL+ (pink) cells in mG+ tubules (green). Nuclei are stained with DAPI (blue). Scale bar: 50 µm. (B, D) Each data point represents the percent of TUNEL+ cells from mG+ tubules scored per animal (n ≥ 6). Statistical analysis was performed using the Mann–Whitney test and is presented as the mean ± SEM. (EH) Representative images and quantification of tubules with thickened basement membrane using PAS staining from 3- and 7-month-old kidneys of Fbxw7f/f and Cdh16Cre;Fbxw7f/f mice. Black arrows show thickened tubular basement membranes (pink). A high-magnification image of the insets is shown on the right-side panel for each genotype. Nuclei are stained with Hematoxylin (blue). Scale bar: 200 µm. (F, H) Each data point represents a percentage of the area affected by tubules with thickened or wrinkled basement membranes scored per animal (n ≥ 4). Statistical analysis was performed using the Mann–Whitney test and is presented as the mean ± SEM. Source data are available online for this figure.
Figure 3
Figure 3. Deletion of Fbxw7 results in urine defects.
Urine defects characterized by variations in (A–C) specific gravity (n ≥ 3), (DF) total protein-to-creatinine ratio (PCR) in urine (n ≥ 4), (G–I) urine volume (n ≥ 4), (J–L) water uptake (n ≥ 4), and (M–O) urine pH (n ≥ 4) from 3-, 7-, and 10-month-old Fbxw7f/f and Cdh16Cre;Fbxw7f/f mice using metabolic cages. Each data point represents one animal. Statistical analysis was performed using the Mann–Whitney test and is presented as the mean ± SEM. Source data are available online for this figure.
Figure 4
Figure 4. Deletion of Fbxw7 causes inflammation and tubulointerstitial fibrosis.
(A, B) Representative images and quantification of F4/80 staining from 3-month-old kidneys of Cdh16Cre;ROSAmT/mG and Cdh16Cre;ROSAmT/mG;Fbxw7f/f mice. (A) White arrows show F4/80+ (pink) cells localized adjacent to the mG+ tubules (green). Nuclei are stained with DAPI (blue). Scale bar: 50 µm. (B) Each data point represents the percent corticomedullary and cortex area of F4/80+ cells per animal (n = 6). Statistical analysis was performed using the Mann–Whitney test and is presented as the mean ± SEM. (C, D) Representative images and quantification of Masson’s trichrome (MT) staining from 3-month-old kidneys of Fbxw7f/f and Cdh16Cre;Fbxw7f/f mice. (C) the left side image shows the whole kidney section scan, and the right side image shows a high-magnification image of the insets. Black arrows show MT staining (purple). Scale bar: 400 µm. (D) Each data point represents the percent area of MT staining per whole kidney section scan per animal (n = 8). Statistical analysis was performed using the Mann–Whitney test and is presented as the mean ± SEM. (E, F) Representative images and quantification of COL1A1 staining from 3-month-old kidneys of Cdh16Cre;ROSAmT/mG and Cdh16Cre;ROSAmT/mG;Fbxw7f/f mice. White arrows show COL1A1 staining (pink) adjacent to the mG+ tubules (green). Nuclei are stained with DAPI (blue). Scale bar: 20 µm. (F) Each data point represents the COL1A1+ percent area per animal (n = 4). Statistical analysis was performed using the Mann–Whitney test and is presented as the mean ± SEM. (G, H) Representative images and quantification of α-SMA staining from 3-month-old kidneys of Fbxw7f/f and Cdh16Cre;Fbxw7f/f mice. White arrows show α-SMA staining (pink) adjacent to the LTA+ cortical region (green). Nuclei are stained with DAPI (blue). Scale bar: 50 µm. (H) Each data point represents the α-SMA+ percent area per animal (n = 6). Statistical analysis was performed using the Mann–Whitney test and is presented as the mean ± SEM. Source data are available online for this figure.
Figure 5
Figure 5. Loss of FBW7 results in TMEM237 downregulation coupled with ciliary defects.
(A) Volcano plot showing differentially expressed proteins from Fbxw7-null cells (Fbxw7 KO#2 and Fbxw7 KO#7) versus empty vector (EV) pool mIMCD3 cells. The red dot represents the TMEM237 protein that is significantly downregulated in Fbxw7-null cells compared to EV pool mIMCD3 cells. n = 3 independent experiments. The data was normalized using cyclic loess, and statistical analysis was performed using linear models for microarray data (limma) with empirical Bayes (eBayes) smoothing to the standard errors. Proteins with an FDR-adjusted P value <0.05 and a fold change >2 were considered significant. (B) Validation of quantitative proteomics using immunoblotting and (C) quantification of TMEM237 from n = 3 independent experiments. Statistical analysis was performed using one-way ANOVA followed by Šídák’s multiple comparisons test and is presented as the mean ± SEM. (D, E) Representative images and quantification of TMEM237 staining from 3-month-old kidneys of Cdh16Cre;ROSAmT/mG and Cdh16Cre;ROSAmT/mG;Fbxw7f/f mice. (D) The white and yellow arrows show TMEM237 expression (pink) in cells where Chd16Cre is active (mG + , green) or inactive (mT + , red) within the same kidney tubule, respectively. Nuclei are stained with DAPI (blue). Scale bar: 20 µm. (E) Each data point represents an average of TMEM237 MFI per animal (n = 5) in cystic tubules that displayed partial Cdh16Cre-based recombination and were positive for TMEM237 staining. Statistical analysis was performed using the Mann–Whitney test and is presented as the mean ± SEM. (FK) Representative images and quantification of acetylated-TUBULIN (cilia) staining from (F) 3-month-old kidneys of Cdh16Cre;ROSAmT/mG and Cdh16Cre;ROSAmT/mG;Fbxw7f/f mice and (I) Fbxw7-null mIMCD3 cells. (F) White arrows show cilia (pink) in mG+ cystic kidney tubules (green). Nuclei are stained with DAPI (blue). Scale bar: 10 µm. (I) White arrows show cilia (red) in mIMCD3 cells after 48 h of serum starvation. Nuclei are stained with DAPI (blue). Scale bar: 10 µm. (G, H) Each data point represents the mean ciliary length per field of view from >20 images or percent ciliation in cystic cells from n ≥ 3 animals. Statistical analysis was performed using the Mann–Whitney test and is presented as the mean ± SEM. (J, K) Each data point represents the mean ciliary length from >70 cells or percent ciliation from >200 cells from n ≥ 3 experiments. Statistical analysis was performed using the Mann–Whitney test and is presented as the mean ± SEM. Source data are available online for this figure.
Figure 6
Figure 6. Increased expression of SOX9 contributes to tubulointerstitial fibrosis and renal function upon loss of FBW7.
(A, B) SOX9 staining and quantification from 3-month-old kidneys of Fbxw7f/f and Cdh16Cre;Fbxw7f/f mice. (A) The black arrows show cystic cells, and the red arrows show non-cystic cells with nuclear SOX9 staining (brown). Nuclei are stained with Hematoxylin (blue). Scale bar: 200 µm. (B) Each data point represents the percentage of SOX9+ cells scored per animal (n = 5) from corticomedullary and cortex regions. Statistical analysis was performed using the Mann–Whitney test and is presented as the mean ± SEM. (C, D) Immunoblot and quantification of SOX9 from whole cell lysates of EV pool and Fbxw7-null (Fbxw7 KO#2) mIMCD3 cells from n = 3 experiments. (EL) Representative images and quantification of (E, F) MT, (G, H) COL1A1, (I, J) α-SMA, and (K, L) WNT4 staining from 3-month-old kidneys of Fbxw7f/f, Cdh16Cre;Fbxw7f/f, and Cdh16Cre;Fbxw7f/f;Sox9+/f mice. Black arrows show (E) MT staining (purple). Scale bar: 200 µm. White arrows show (G) COL1A1, (I) α-SMA, and (K) WNT4 staining (pink). Nuclei are stained with DAPI (blue). Scale bar: (G, K) 20 µm, (I) 50 µm. Each data point represents the percent area of (F) MT (n ≥ 8) staining, (H) COL1A1+ (n = 4) or (J) α-SMA+ (n = 4) percent area, and (L) an average of WNT4 (n ≥ 5) MFI per animal. Statistical analysis was performed using one-way ANOVA followed by Šídák’s multiple comparisons test and is presented as the mean ± SEM. (M) qPCR of Wnt4 mRNA from EV pool and Fbxw7-null (Fbxw7 KO#2) mIMCD3 cells from n = 6 experiments. (N) Serum BUN (n ≥ 10), (O) Creatinine (n ≥ 10), (P) Cytastin C (n ≥ 9), and (Q) 2KW/BW (n ≥ 10) from 3-month-old Fbxw7f/f, Cdh16Cre;Fbxw7f/f, and Cdh16Cre;Fbxw7f/f;Sox9+/f mice. Each data point represents one animal. Statistical analysis was performed using one-way ANOVA followed by Šídák’s multiple comparisons test and is presented as the mean ± SEM. Source data are available online for this figure.
Figure 7
Figure 7. Increased expression of SOX9 in NPHP patient kidney biopsy and CaggCreERT2;Ift88f/f mouse model.
(A, B) SOX9 staining and quantification from a 12-year-old female NPHP patient having a complete deletion of NPHP1. Three different images are shown from the same patient biopsy. Black arrows show SOX9+ cells (brown). Nuclei are stained with Hematoxylin (blue). Scale bar: 200 µm. (B) Percentage of SOX9+ cells from control and NPHP1 patient biopsy. (C, D) SOX9 staining and quantification from 9-month-old Ift88f/f and CaggCreERT2;Ift88f/f kidneys. Black arrows show SOX9+ cells (brown). Nuclei are stained with Hematoxylin (blue). Scale bar: 200 µm. (D) Each data point represents the percentage of SOX9+ cells scored from cystic tubules per animal (n = 4). Statistical analysis was performed using the Mann–Whitney test and is presented as the mean ± SEM. Source data are available online for this figure.
Figure EV1
Figure EV1. Deletion of Fbxw7 results in cyst formation in different tubular segments of the kidney.
(A) Cystic index represented as the percentage of cystic area per kidney section from 1-, 3-, 7-, and 10-month-old Fbxw7f/f and Cdh16Cre;Fbxw7f/f mice. Each data point represents one animal (n ≥ 3). Statistical analysis was performed using two-way ANOVA and is presented as the mean ± SEM. (B) Representative images of LTA+ and mG+ cystic tubules in Cdh16Cre;ROSAmT/mG;Fbxw7f/f (middle and right panels) and Cdh16Cre;ROSAmT/mG (left panel) mice. White arrows show cystic mG+ tubules that are LTA + . Nuclei are stained with DAPI (blue). Scale bar: 50 µm. (C–J) Representative images of immunofluorescence staining for (C, D) proximal tubule marker, Lotus tetragonolobus agglutinin (LTA), (E, F) thick ascending limb of the loop of Henle marker, NKCC2, and (G, H) collecting duct marker, Dolichos biflorus agglutinin (DBA) from 3- and 7-month-old kidneys of Fbxw7f/f and Cdh16Cre;Fbxw7f/f mice. White arrows show dilated or cystic tubular segments of the kidney that are positive for (C, D) LTA (green), (E, F) NKCC2 (pink), and (G, H) DBA (red). Nuclei are stained with DAPI (blue). Scale bar: 50 µm. (I, J) Pie chart displaying the percentage of cystic tubules distributed across different kidney segments from 3- and 7-month-old Fbxw7f/f and Cdh16Cre;Fbxw7f/f mice (n ≥ 3).
Figure EV2
Figure EV2. Deletion of Fbxw7 results in modest glomerular cysts and Bowman’s capsule thickening.
(A–F) Representative images and quantification of glomerular cysts and mild thickening of Bowman’s capsule (black arrows) using PAS staining from 3- and 7-month-old kidneys of Fbxw7f/f and Cdh16Cre;Fbxw7f/f mice. Nuclei are stained with Hematoxylin (blue). Scale bar: 200 µm. (B, E) Pathology score for the mild thickening of Bowman’s capsule and (C, F) percentage of glomerular cysts scored per animal (n = 6). Statistical analysis was performed using the Mann–Whitney test and is presented as the mean ± SEM.
Figure EV3
Figure EV3. Spatio-temporal characterization of increased SOX9 expression in Fbxw7-deletion-based NPHP-like mouse model.
(A–D) SOX9 staining and quantification from different kidney regions from P16-, 3-, and 7-month-old Fbxw7f/f and Cdh16Cre;Fbxw7f/f mice. (A, B) Black arrows show SOX9+ cells (brown). Nuclei are stained with Hematoxylin (blue). Scale bar: 100 µm. (C) Pie chart displaying the percentage SOX9+ cells distributed across different kidney regions from 3-month-old Fbxw7f/f and Cdh16Cre;Fbxw7f/f mice. (D) Each data point represents the percentage of SOX9+ cells scored per animal from P16-, 3-, and 7-month-old Fbxw7f/f and Cdh16Cre;Fbxw7f/f mice (n = 3). Statistical analysis was performed using two-way ANOVA and is presented as the mean ± SEM. (E, F) Representative images and quantification of SOX9+ cells within ATP1A1+ tubules that have lost ATP1A1 expression. (E) The white arrow shows the SOX + ATP1A1- cell, and the yellow arrow shows the SOX9-ATP1A1+ cell within the same cystic tubule. Nuclei are stained with DAPI (blue). Scale bar: 20 µm. (F) Each data point represents the percentage of SOX9+ cells scored per animal from ATP1A1+ tubules of 3-month-old Cdh16Cre;Fbxw7f/f mice. (G, H) Representative images and distribution of SOX9+ cells in LTA+normal-looking, LTA+brushed proximal tubules, and LTA- tubules. (G) The white arrow shows SOX9+ cells in respective tubules. Nuclei are stained with DAPI (blue). Scale bar: 20 µm. (I, J) SOX9 staining and quantification from 3-month-old kidneys of Cdh16Cre;ROSAmT/mG and Cdh16Cre;ROSAmT/mG;Fbxw7f/f mice. (I) The white and black arrows show nuclear SOX9 staining (pink) in mG+ cystic and non-cystic tubules (green), respectively. Nuclei are stained with DAPI (blue). Scale bar: 20 µm. (J) Each data point represents the percentage of SOX9+ cells scored from mG+ cytic tubules per animal (n = 5). Statistical analysis was performed using the Mann–Whitney test and is presented as the mean ± SEM.

References

    1. Aggarwal S, Wang Z, Rincon Fernandez Pacheco D, Rinaldi A, Rajewski A, Callemeyn J, Van Loon E, Lamarthee B, Covarrubias AE, Hou J et al (2024) SOX9 switch links regeneration to fibrosis at the single-cell level in mammalian kidneys. Science 383:eadd6371 - PMC - PubMed
    1. Akira M, Suzuki H, Ikeda A, Iwasaki M, Honda D, Takahara H, Rinno H, Tomita S, Suzuki Y (2021) Atypical histological abnormalities in an adult patient with nephronophthisis harboring NPHP1 deletion: a case report. BMC Nephrol 22:261 - PMC - PubMed
    1. Ala-Mello S, Kivivuori SM, Ronnholm KA, Koskimies O, Siimes MA (1996) Mechanism underlying early anaemia in children with familial juvenile nephronophthisis. Pediatr Nephrol 10:578–581 - PubMed
    1. Attanasio M, Uhlenhaut NH, Sousa VH, O’Toole JF, Otto E, Anlag K, Klugmann C, Treier AC, Helou J, Sayer JA et al (2007) Loss of GLIS2 causes nephronophthisis in humans and mice by increased apoptosis and fibrosis. Nat Genet 39:1018–1024 - PubMed
    1. Barbelanne M, Hossain D, Chan DP, Peranen J, Tsang WY (2015) Nephrocystin proteins NPHP5 and Cep290 regulate BBSome integrity, ciliary trafficking and cargo delivery. Hum Mol Genet 24:2185–2200 - PMC - PubMed

MeSH terms