Comparative Study
. 2025 Apr;4(4):412-432.
doi: 10.1038/s44161-025-00628-y. Epub 2025 Apr 10.

Single-cell RNA sequencing reveals sex differences in the subcellular composition and associated gene-regulatory network activity of human carotid plaques

Affiliations
Comparative Study

Single-cell RNA sequencing reveals sex differences in the subcellular composition and associated gene-regulatory network activity of human carotid plaques

Katyayani Sukhavasi et al. Nat Cardiovasc Res. 2025 Apr.

Abstract

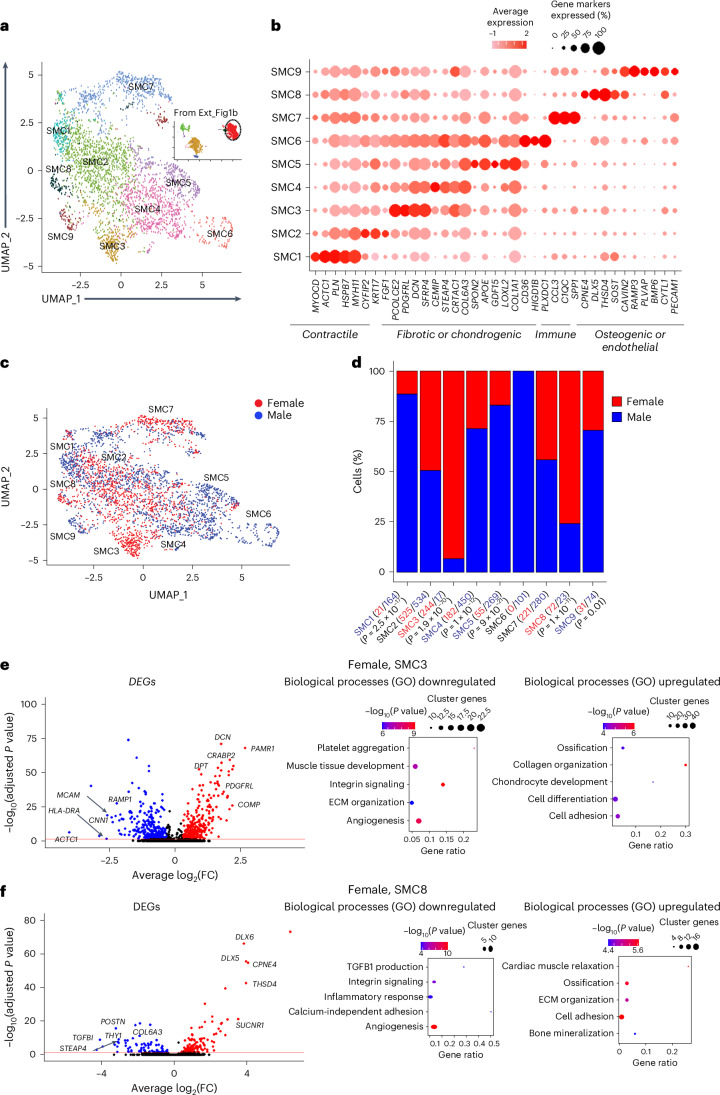
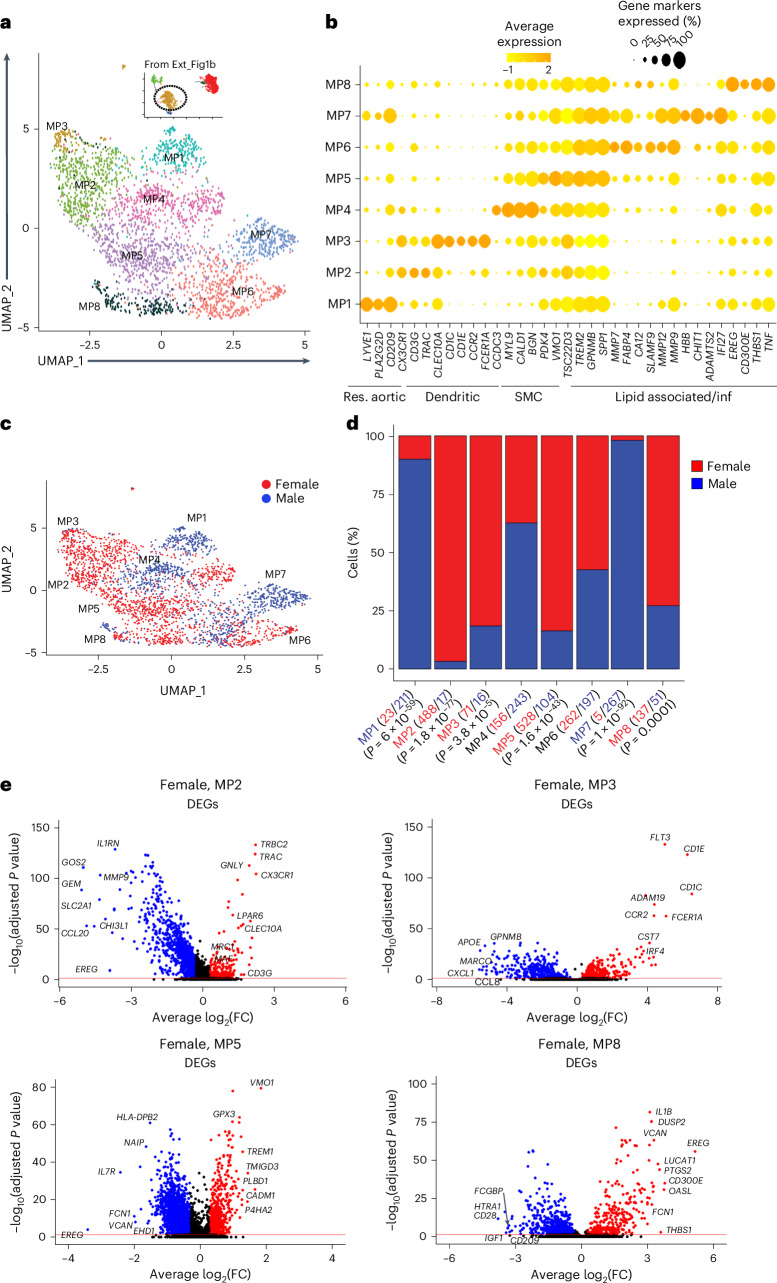
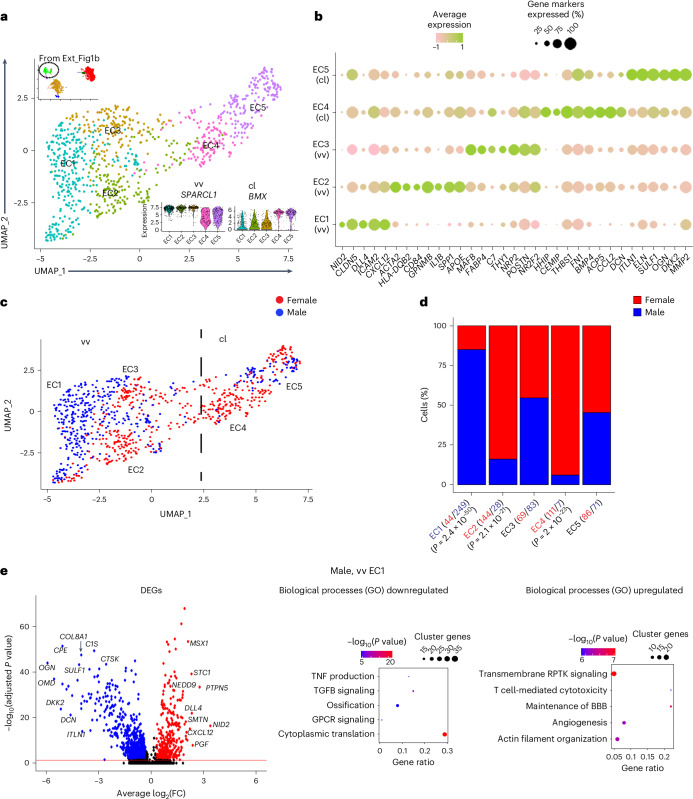
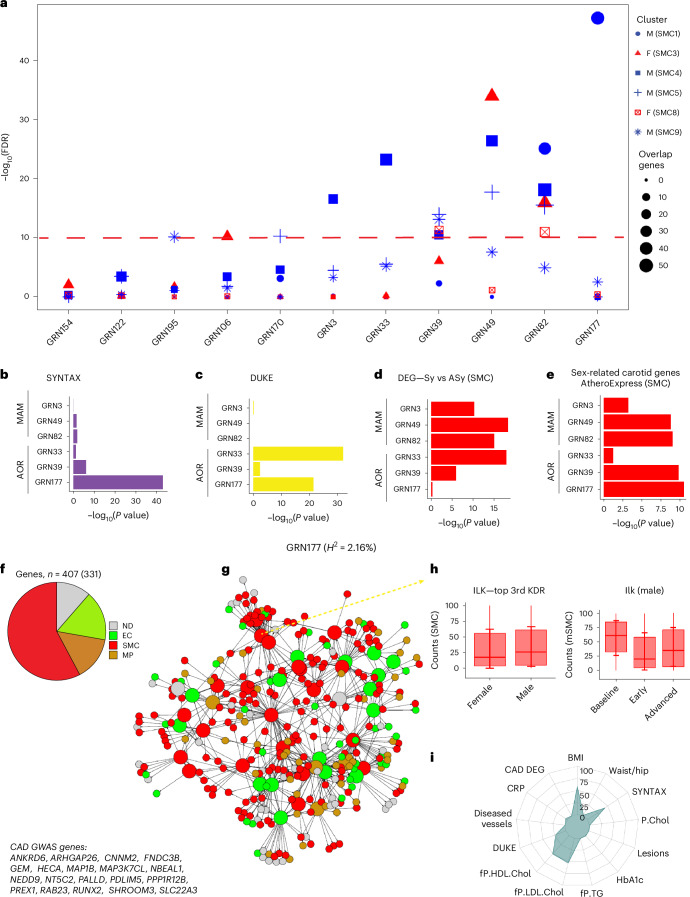
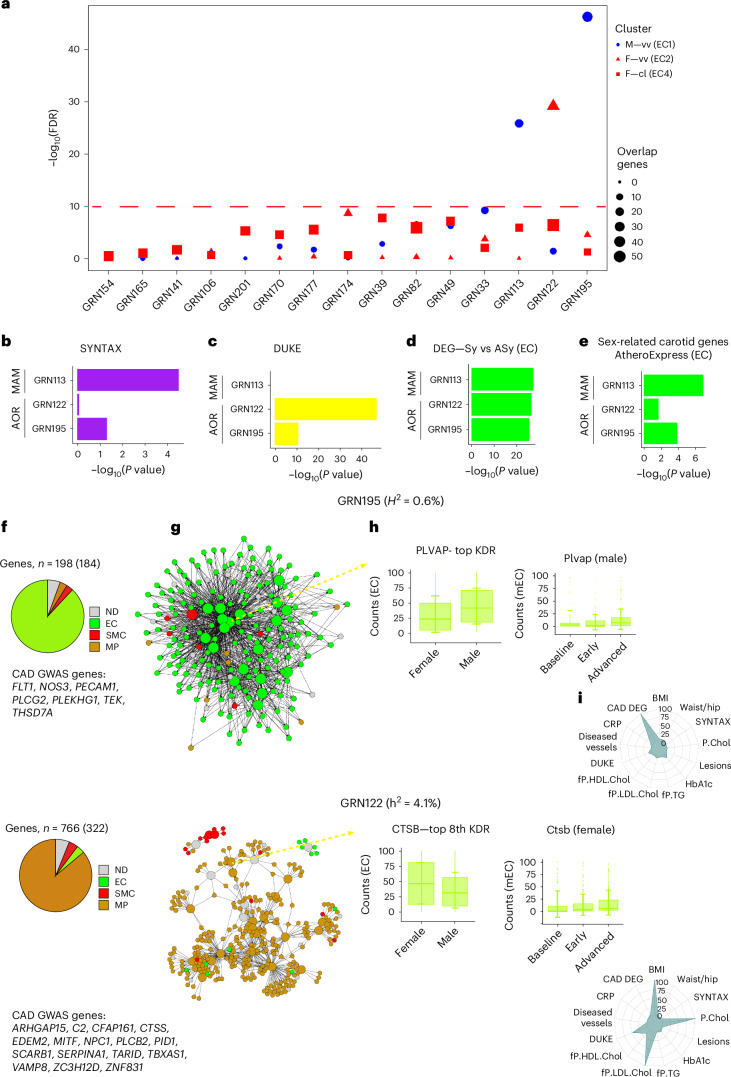
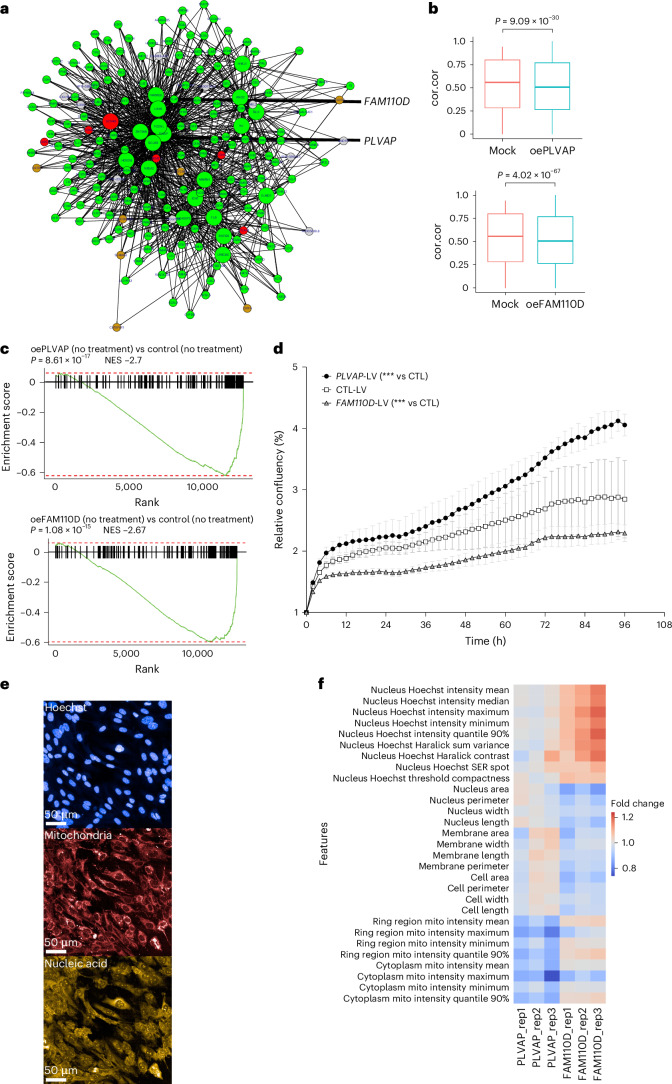
Carotid stenosis causes ischemic stroke in both sexes, but the clinical presentation and plaque characteristics differ. Here we run deep single-cell sequencing of 7,690 human carotid plaque cells from male and female patients. While we found no sex differences in major cell types, we identified a predominance of the osteogenic phenotype in smooth muscle cells, immunomodulating macrophages (MPs) and endothelial cells (ECs) undergoing endothelial-to-mesenchymal transition in females. In males, we found smooth muscle cells with the chondrocytic phenotype, MPs involved in tissue remodeling and ECs with angiogenic activity. Sex-biased subcellular clusters were integrated with tissue-specific gene-regulatory networks (GRNs) from the Stockholm-Tartu Atherosclerosis Reverse Network Engineering Task study. We identified GRN195 involved in angiogenesis and T cell-mediated cytotoxicity in male ECs, while in females, we found GRN33 and GRN122 related to TREM2-/TREM1+ MPs and endothelial-to-mesenchymal transition. The impact of GRN195 on EC proliferation in males was functionally validated, providing evidence for potential therapy targets for atherosclerosis that are sex specific.


Conflict of interest statement

Competing interests: J.L.M.B. and A.R. are shareholders of Clinical Gene Networks AB (CGN) that has an invested interest in STARNET. C.L.M. has received funding from AstraZeneca for an unrelated project. All other authors declare no competing interests.

Figures

Fig. 1
Fig. 1. Schematic overview of the overall study design.
A schematic illustrating the key stages and components of the overall study design. Credit: human with carotid artery, ref. under a Creative Commons license CC BY 4.0; Eppendorf tube, TogoTV (© 2016 DBCLS TogoTV) under a Creative Commons license CC BY 4.0; cytometry, Flaticon.com; PCR plate, Pexels.com; mouse and Petri dish, Pixabary.com; mouse model, ref. under a Creative Commons license CC BY 4.0; GRN network, ref. , Springer Nature America. LIV, liver.
Fig. 2
Fig. 2. Single-cell RNA sequence characterization of SMC subcellular clusters in carotid plaques of female and male patients.
a, Subcellular clusters of human SMC carotid plaques visualized with UMAP. Ext_Fig1b, UMAP of major cell types. This shows that SMC cell types circled in black have been subclustered to get 9 subcellular clusters, SMC1–SMC9. b, Dot plot showing expression levels of functional gene markers within the SMC subclusters. SMC6 was excluded from further analysis because it emerged from only one patient. c, UMAP of SMC subcellular clusters highlighted for cells isolated from carotid plaques of female and male patients. d, Bar plots showing the relative sex specificity of SMC subcluster cells. The total number of cells in each category are shown in parentheses. P values were calculated using chi-square statistics assessing the statistical significance between observed and expected values. e, Volcano plot showing differentially expressed SMC3 genes (red, upregulated; blue, downregulated) using all other SMC subclusters as background. Cell-type-specific gene enrichment was calculated using the Wilcoxon rank-sum test (log2(fold) > 0.3, Bonferroni-adjusted P < 0.005). Dot plots show top-ranked biological processes according to GO. Gene ratios (x axis) are the relative number of subcluster genes in relation to the total gene count in each GO category. Dot size indicates the actual number of subcluster genes in each GO category. GO enrichment −log10(P values) were calculated with Fisher exact test. Cluster genes indicate the number of SMC3 subcluster genes overlapping with the GO category. ECM, extracellular matrix. f, Volcano plot showing differentially expressed SMC8 genes (red, upregulated; blue, downregulated) using all other SMC subclusters as background. Cell-type-specific gene enrichment was calculated using Wilcoxon rank–sum test (log2(fold) > 0.3, Bonferroni-adjusted P < 0.005). Dot plots show top-ranked biological processes according to GO. Gene ratios (x axis) are the relative number of subcluster genes in relation to the total gene count in each GO category. Dot size indicates the actual number of subcluster genes in each GO category. GO enrichment −log10(P values) were calculated with Fisher exact test. Cluster genes indicate the number of SMC8 subcluster genes overlapping with the GO category. Source data
Fig. 3
Fig. 3. Single-cell RNA sequence characterization of MP subcellular clusters in carotid plaques of female and male patients.
a, Subcellular clusters of human carotid plaque MPs visualized with UMAP. b, Dot plot showing expression levels of functional gene markers within the MP subclusters. Res., resident; inf, inflammatory. c, UMAP of MP subcellular clusters highlighted for cells isolated from carotid plaques of female and male patients. d, Bar plots showing the relative sex specificity of MP subcluster cells. The total number of cells in each category are shown in parentheses. P values were calculated using chi-square statistics assessing the statistical significance between observed and expected values. e, Volcano plots showing DEGs in the indicated MP subclusters using all other MP subclusters as background (red, upregulated; blue, downregulated). Cell-type-specific gene enrichment was calculated using Wilcoxon rank-sum test (log2(fold) > 0.3, Bonferroni-adjusted P < 0.005). Source data
Fig. 4
Fig. 4. Single-cell RNA sequence characterization of EC subcellular clusters in carotid plaques of female and male patients.
a, Subcellular clusters of human carotid plaque ECs visualized with UMAP. vv, vasa vasorum; cl, carotid lumen. The inserted violin plots show the EC subcluster expression levels of the capillary EC marker, SPARCL1, and the luminal EC marker, VWF. b, Dot plot showing the expression levels of functional gene markers within the five EC subclusters. c, UMAPs of EC subcellular clusters highlighted for cells isolated from carotid plaques of female and male patients. d, Bar plots showing the relative sex specificity of cells in each EC subcluster. The total number of cells collected in each category are shown in parentheses. P values were calculated using chi-square statistics assessing the statistical significance between observed and expected values. e, Volcano plots showing differentially expressed EC1 genes (red, upregulated; blue, downregulated) using all other EC subcluster as background. Cell-type-specific gene enrichment was calculated using Wilcoxon rank-sum test (log2(fold) > 0.3, Bonferroni-adjusted P < 0.005). Dot plots show top-ranked biological processes according to GO. Gene ratios (x axis) are the relative number of subcluster genes in relation to the total gene count in each GO category. Dot size indicates the actual number of subcluster genes in each GO category. GO enrichment −log10(P values) were calculated with Fisher exact test. Cluster genes indicate the number of EC1 subcluster genes overlapping with the GO category. GPCR, G protein-coupled receptor; RPTK, receptor protein tyrosine kinase; BBB, blood–brain barrier. Source data
Fig. 5
Fig. 5. Enrichment of sex-diversified SMC subcluster genes in human GRNs.
a, Dot plot showing 11 top-ranked arterial wall GRNs (x axis) according to their enrichments in genes of sex-specified SMC subclusters in the carotid plaques. The y axis shows −log10(10% FDR) (highlighted). Dot size indicates the number of genes overlapping between the SMC subclusters and GRNs. M, male; F, female. b, Horizontal bar graph showing the statistical enrichments (x axis, −log10(P value)) of genes associated with SYNTAX scores in the arterial wall-specific GRNs above −log(10% FDR) in a. c, Horizontal bar graph showing the statistical enrichments (x axis, −log10(P value)) of genes associated with Duke scores in the arterial-wall-specific GRNs above −log(10% FDR) in a. d, Horizontal bar graph showing the enrichment significances (x axis, −log10(P value)) of DEGs in indicated SMC subclusters between symptomatic (Sy) and asymptomatic (Asy) carotid plaques in the arterial wall GRNs above −log(10% FDR) in a. e, Horizontal bar graph showing the enrichment significances (x axis, −log10(P value)) in indicated SMC subclusters of DEGs in Athero-Express scRNA-seq carotid plaque data between 20 females and 26 males in the arterial wall GRNs above −log(10% FDR) in a. f, Pie chart showing the relative cell type specificity of genes in GRN177 according to the scRNA-seq data (Methods). Below the pie chart are abbreviations of GRN177 GWAS CAD candidate genes. g, GRN177 color coded according to the cell type specificity. Bigger-sized nodes are key driver genes. h, Box plot (left) showing sex-specific expression of top-ranked key driver genes isolated from female (n = 7) and male (n = 8) carotid plaques and (right) corresponding expression pattern during the progression of atherosclerosis in female (n = 18) or male (n = 28) Ldlr/Apob100/100 mice (Methods). ND, not determined; KDR: key driver; mSMC: mouse SMC clusters in Ldlr−/−Apob100/100 mice. Top or rank, the key driver’s hierarchical ranking in the GRN. H2, broad sense heritability contribution of GRN177 (%). The red center line denotes the median value (50th percentile), and the red box contains the 25th to 75th percentiles of the dataset. The red whiskers mark the 5th and 95th percentiles. i, Radar plot showing the statistical significance of key cardiometabolic phenotype associations with GRN177. The significance of GRN–phenotype associations (−log10; P = 0–100) was calculated by aggregating GRN gene-level phenotype associations (Pearson correlation two tailed t-test) corrected for the total number of STARNET GRNs (n = 135) and the number of genes in each GRN using the Benjamini–Hochberg procedure. fP.HDL.Chol, fasting plasma high-density lipoprotein cholesterol levels; fP.LDL.Chol, fasting plasma low-density lipoprotein cholesterol levels; fP.TG, fasting plasma triglyceride levels; HbA1c, hemoglobin A1C/glycated hemoglobin; P.Chol, plasma cholesterol levels. Source data
Fig. 6
Fig. 6. Enrichment of sex-diversified MP subcluster genes in human GRNs.
a, Dot plot showing 18 top-ranked arterial wall GRNs (x axis) according to their enrichments in genes of sex-specified MP subclusters in the carotid plaques. The y axis shows −log10(10% FDR) (highlighted). Dot size indicates the number of genes overlapping between MP subclusters and GRNs. b, Horizontal bar graph showing the statistical enrichments (x axis, −log10(P value)) of genes associated with SYNTAX scores of the arterial-wall-specific GRNs above −log(10% FDR) in a. c, Horizontal bar graph showing the statistical enrichments (x axis, −log10(P value)) of genes associated with Duke scores in the arterial-wall-specific GRNs above −log(10% FDR) in a. d, Horizontal bar graph showing the enrichment significances (x axis, −log10(P value)) of DEGs in indicated MP subclusters between symptomatic and asymptomatic carotid plaques in the arterial wall GRNs above −log(10% FDR) in a. e, Horizontal bar graph showing the enrichment significances (x axis, −log10(P value)) in indicated MP subclusters of DEGs in Athero-Express scRNA-seq carotid plaque data between 20 females and 26 males in the arterial-wall GRNs above −log(10% FDR) in a. f, Pie chart showing the relative cell type specificity of genes in GRN33 (top) and GRN174 (bottom) according to the scRNA-seq data (Methods). Below the pie chart are abbreviations of GRN33 (top) and GRN174 (bottom) GWAS CAD candidate genes. g, GRN33 (top) and GRN174 (bottom) color coded according to cell type specificity. Bigger-sized nodes are the key driver genes. h, Box plots (left) showing sex-specific expression of top-ranked key drivers isolated from female (n = 7) and male (n = 8) carotid plaques and (right) corresponding expression patterns during the progression of atherosclerosis in female (n = 18) or male (n = 28) Ldlr/Apob100/100 mice (Methods). mMP, mouse MP clusters in Ldlr−/−Apob100/100 mice. Top or rank, the key driver’s hierarchical ranking in the GRN. H2, broad sense heritability contributions of GRN33 (top) and GRN174 (bottom) (%). The golden center line denotes the median value (50th percentile), and the golden box contains the 25th to 75th percentiles of the dataset. The golden whiskers mark the 5th and 95th percentiles. i, Radar plot showing the statistical significance of key cardiometabolic phenotype associations with GRN33 (top) and GRN174 (bottom). The significance of GRN–phenotype associations (−log10; P = 0–100) was calculated by aggregating GRN gene-level phenotype associations (Pearson correlation two-tailed t-test) corrected for the total number of STARNET GRNs (n = 135) and the number of genes in each GRN using the Benjamini–Hochberg procedure. Source data
Fig. 7
Fig. 7. Enrichments of sex-diversified EC subcluster genes in human GRNs.
a, Dot plot showing 15 top-ranked arterial wall GRNs (x axis) according to their enrichments in genes of sex-specified EC subclusters in the carotid plaques. The y axis shows −log(10% FDR) (highlighted). Dot size indicates the number of genes overlapping between EC subclusters and GRNs. b, Horizontal bar graph showing the statistical enrichments (x axis, −log10(P value)) of genes associated with SYNTAX scores of the arterial-wall-specific GRNs above −log(10% FDR) in a. c, Horizontal bar graph showing the statistical enrichments (x axis, −log10(P value)) of genes associated with Duke scores in the arterial-wall-specific GRNs above −log(10% FDR) in a. d, Horizontal bar graph showing the enrichment significances (x axis, −log10(P value)) of DEGs in indicated EC subclusters between symptomatic and asymptomatic carotid plaques in the arterial-wall GRNs above −log(10% FDR) in a. e, Horizontal bar graph showing the enrichment significances (x axis, −log10(P value)) in indicated EC subclusters of DEGs in Athero-Express scRNA-seq carotid plaque data between 20 females and 26 males in the arterial-wall GRNs above −log(10% FDR) in a. f, Pie chart showing the relative cell type specificity of genes in GRN195 (top) and GRN122 (bottom) according to the scRNA-seq data (Methods). Below the pie chart are abbreviations of GRN195 (top) and GRN122 (bottom) GWAS CAD candidate genes. g, GRN195 (top) and GRN122 (bottom) color coded according to the cell type specificity. Bigger-sized nodes are key driver genes. h, Bar plot (left) showing sex-specific expression of top-ranked key drivers isolated from female (n = 7) and male (n = 8) carotid plaques and (right) corresponding expression patterns during the progression of atherosclerosis in female (n = 18) or male (n = 28) Ldlr−/Apob100/100 mice (Methods). Top or rank, key driver’s hierarchical ranking in the GRN. H2, broad sense heritability contributions of GRN (%). The green center line denotes the median value (50th percentile), and the green box contains the 25th to 75th percentiles of the dataset. The green whiskers mark the 5th and 95th percentiles. i, Radar plot showing the statistical significance of key cardiometabolic phenotype associations with GRN195 (top) and GRN122 (bottom). The significance of GRN–phenotype associations (−log10; P = 0–100) was calculated by aggregating GRN gene–level phenotype associations (Pearson correlation two-tailed t-test) corrected for the total number of STARNET GRNs (n = 135) and the number of genes in each GRN using the Benjamini–Hochberg procedure. Source data
Fig. 8
Fig. 8. Experimental validation of GRN195 by overexpressing its top key drivers PLVAP and FAM110D in HAECs.
The top key drivers of GRN195, PLVAP and FAM110D, were overexpressed in HAECs followed by RNA-seq. a, PLVAP and FAM110D are highlighted in the color-coded GRN195 network according to the cell type specificity. b, Average pair-wise correlation of GRN195 coding genes across different conditions, comparing Mock, oePLVAP and oeFAM110D groups with four replicates each. Mock, cells with lenti virus without construct, i.e., acts as control; oePLVAP, primary cells transduced with lentiviral vectors to overexpress PLVAP gene; oeFAM110D, primary cells transduced with lentiviral vectors to over express FAM110D gene; cor.cor, concordance of correlation structure. In the box plot, the center line denotes the median value (50th percentile), and the box contains the 25th to 75th percentiles of the dataset. The statistical test was conducted using t-test (two-sided). No adjustment was made and there was no multiple comparison. c, GSEA of RNA-seq data of HAECs overexpressing PLVAP and FAM110D. The NES indicate the direction and strength of gene set enrichment. The statistical test used was GSEA, which uses a one-sided test to assess whether a predefined gene set is significantly enriched at either the top or bottom of the ranked gene list. P values were calculated using permutation testing, and multiple comparisons were adjusted using the FDR correction. d, Relative proliferation in the PLVAP group compared with the control (CTL) group shows a significant increase, while the FAM110D group shows a significant decrease relative to CTL. Statistical analysis was conducted using repeated-measures ANOVA (two sided) Dunnett’s multiple comparison test, P < 0.0001. Data represent the mean ± s.d. ***, P < 0.0001. e, Representative images of cell painting showing nuclear (blue), mitochondria (red) and nucleic acid (yellow) stains at day 6 in LV-overexpressing HAEC cells. Scale bar = 50 µm. A total of 4 wells per group including 10 regions per well were imaged (n = 40 images per group) with two biological replicates. f, Heatmap illustrating the effect of LV-FAM110 and LV-PLVAP overexpression on cell phenotypic features in HAECs at day 6 detected by cell painting. A total of 4 wells per group including 10 regions per well were imaged (n = 40 images per group) with Opera Phenix Plus High Content Screening System, and the cell morphological signature was analyzed by Harmony analysis software. Two independent experiments were performed. Heatmap values show the fold changes over the LV-EGFP control vector. mito, mitochondria. Source data
Extended Data Fig. 1
Extended Data Fig. 1. Major cell types of the human carotid plaque.
a) Uniform Manifold Approximation and Projection (UMAP) featuring single cell gene expression levels of established cell-type markers of endothelial cells (ECs, Claudin5 (CLDN5)), macrophages (MPs, (CD68)), pericytes (PCs, ATP binding cassette subfamily C member 9 (ABCC9)), smooth muscle cells (SMCs, Myosin11 (MYH11)) and T-cells (T-cell surface glycoprotein CD3 Epsilon chain (CD3E)). b) UMAP of major cell types. c) Bar plots showing the relative contribution of major cell types isolated from female (n = 7) and male (n = 8) carotid plaques. (), indicates the total number of cells in each cluster. In the boxplot, centre line denotes the median value (50th percentile), the box contains the 25th to 75th percentiles of the dataset. P-values were calculated using students´ T-test (two-tailed) by comparing female and male major cell type numbers. No adjustment was made. d) Bar plots showing the relative contributions of major cell types isolated from asymptomatic (n = 7) or symptomatic (n = 8) carotid plaques. (), indicates the total number of cells in each cluster. Source data
Extended Data Fig. 2
Extended Data Fig. 2. Carotid plaque SMC subcellular genes and related biological processes.
a-d) Volcano plots (left) showing SMC1 (a), SMC4 (b), SMC5 (c), and SMC9 (d) subcluster DEGs using all other SMC subclusters as background. Cell type–specific gene enrichment was calculated using Wilcoxon Rank-Sum test (log2-fold >0.3, Bonferroni-adjusted P < 0.005). Dot plots show top-ranked biological processes according to GO. Gene Ratios (x-axis) are the relative number of subcluster genes in relation to the total gene count in each GO category. Dot size indicates the actual number of subcluster genes in each GO category. GO enrichment −log10 P values were calculated with Fisher exact test. Cluster genes indicate the number of subcluster genes overlapping with the GO category. Source data
Extended Data Fig. 3
Extended Data Fig. 3. Carotid plaque MP subcellular genes and related biological processes.
a) Dot plots of MP2, MP3, MP5 and MP8 show top-ranked biological processes according to GO. Gene Ratios (x-axis) are the relative number of subcluster genes in relation to the total gene count in each GO category. Dot size indicates the actual number of subcluster genes in each GO category. GO enrichment −log10 P values were calculated with Fisher exact test. Cluster genes indicate the number of subcluster genes overlapping with the GO category. b) Volcano plots (left) of MP1 subcluster DEGs using all other MP subclusters used as background. Cell type–specific gene enrichment was calculated using Wilcoxon Rank-Sum test (log2-fold >0.3, Bonferroni-adjusted P < 0.005). Dot plots (right) show top-ranked biological processes according to GO. Gene Ratios (x-axis) are the relative number of subcluster genes in relation to the total gene count in each GO category. Dot size indicates the actual number of subcluster genes in each GO category. GO enrichment −log10 P values were calculated with Fisher exact test. Cluster genes indicate the number of subcluster genes overlapping with the GO category. c) Volcano plots (left) of MP7 subcluster DEGs using all other MP subclusters used as background. Cell type–specific gene enrichment was calculated using Wilcoxon Rank-Sum test (log2-fold >0.3, Bonferroni-adjusted P < 0.005). Dot plots (right) show top-ranked biological processes according to GO. Gene Ratios (x-axis) are the relative number of subcluster genes in relation to the total gene count in each GO category. Dot size indicates the actual number of subcluster genes in each GO category. GO enrichment −log10 P values were calculated with Fisher exact test. Cluster genes indicate the number of subcluster genes overlapping with the GO category. Source data
Extended Data Fig. 4
Extended Data Fig. 4. Carotid plaque EC subcellular genes and related biological processes.
a) Volcano plots showing differentially expressed EC2 genes (red, up-regulated; blue, down-regulated) using all other EC subclusters as background. Cell type–specific gene enrichment was calculated using Wilcoxon Rank-Sum test (log2-fold >0.3, Bonferroni-adjusted P < 0.005). Dot plots show top-ranked biological processes according to GO. Gene Ratios (x-axis) are the relative number of subcluster genes in relation to the total gene count in each GO category. Dot size indicates the actual number of subcluster genes in each GO category. GO enrichment −log10 P values were calculated with Fisher exact test. Cluster genes indicate the number of EC2 subcluster genes overlapping with the GO category. b) Volcano plots showing differentially expressed EC4 genes (red, up-regulated; blue, down-regulated) using all other EC subclusters as background. Cell type–specific gene enrichment was calculated using Wilcoxon Rank-Sum test (log2-fold >0.3, Bonferroni-adjusted P < 0.005). Dot plots show top-ranked biological processes according to GO. Gene Ratios (x-axis) are the relative number of subcluster genes in relation to the total gene count in each GO category. Dot size indicates the actual number of subcluster genes in each GO category. GO enrichment −log10 P values were calculated with Fisher exact test. Cluster genes indicate the number of EC4 subcluster genes overlapping with the GO category. Source data
Extended Data Fig. 5
Extended Data Fig. 5. Enrichment of sex-diversified subcluster genes in human GRNs.
135 tissue-specific GRNs inferred from genotype and bulk RNAseq data of two arterial wall (atherosclerotic aortic root, and the non- or early atherosclerosis mammary artery and four metabolic (liver, skeletal muscle, subcutaneous fat and visceral abdominal fat) tissues obtained from 600 CAD patients of the STARNET study were inferred using block-wise WCGNA and the GENIE3 algorithms, as described. The enrichments of sex-diversified subcluster genes in the SMC-specific GRN82 and GRN49 shown in Fig. 5a. a) Pie charts showing the relative cell type specificity of genes in GRN82 (top), GRN49 (bottom) according to the scRNA seq data (Methods). Below the pie charts, abbreviations of GRN82 (top) and GRN 49 (bottom) GWAS CAD candidate genes. b) GRN82 (top) and GRN 49 (bottom) color-coded according to the cell type specificity. Bigger size nodes are key driver genes. c) Radar plot showing statistical significance of key cardiometabolic phenotypes associations with GRN82 (top) and GRN 49 (bottom). The significance of GRN-phenotype associations ( − log10; P = 0–100) was calculated by aggregating GRN gene-level phenotype associations (Pearson correlation two tailed t-test) corrected for the total number of STARNET GRNs (n = 135) and the number of genes in each GRN using the Benjamini-Hochberg procedure. Source data
Extended Data Fig. 6
Extended Data Fig. 6. Independent evaluation of GRN33, GRN195 and GRN122 cell-specificity, reproducibility and roles in atherosclerotic cardiovascular disease.
a) GRN33 (top), GRN195 (middle) and GRN122 (bottom) cell-type specificity according to the enrichment of cell-type determined genes in scATAC-seq data obtained from 41 human coronary artery tissue samples (Methods). Dot plots show odds ratio of enrichment of GRN33, GRN195 and GRN122 module genes for marker genes determined from integrated snATAC-seq and scRNA-seq profiles obtained from atherosclerotic coronary artery tissues (Methods). b) GRN33 (top), GRN195 (middle) and GRN122 (bottom) reproducibility according to NetRep. The original GRN33 connectivity in bulk RNAseq data from the atherosclerotic aortic wall in STARNET was compared with that of two bulk coronary (UVA and GTEx), primary blood MP cell (STARNET), and one additional primary blood MP (NGS-PREDICT, Ma et al., unpublished) RNAseq datasets filtered for female donors. The original GRN195 connectivity in bulk RNAseq data from the atherosclerotic aortic wall in STARNET was compared with that of two coronary (UVA and GTEx) and one human aortic endothelial cell (HAEC) RNAseq datasets, the latter filtered for male donors. The original GRN122 connectivity in bulk RNAseq data from the atherosclerotic aortic wall in STARNET was compared with that of bulk coronary and aorta (GTEx), primary blood MP cell (STARNET), and one additional primary blood MP (NGS-PREDICT, Ma et al., unpublished). RNAseq datasets filtered for female donors. ‘cor.cor´ measures the concordance of correlation structures; ‘cor.degree´ measures the concordance of the weighted degrees; ‘cor.contrib´ measures the concordance of node contributions; ‘avg.cor’ measures the average magnitude of correlation coefficients and ‘avg.contrib´ measures the average magnitude of node contributions. The bar shows log−10 P-values. P-values were adjusted for multiple testing using the Benjamini & Hochberg method. c) Barplots showing the odds ratio (OR) for GRN33 (top), GRN195 (middle) and GRN122 (bottom) enrichments in coronary artery differential expressed genes comparing (1) lesions (n = 28) versus non-lesions (n = 26), (2) ischemic (n = 38) versus non-ischemic (n = 23) heart explants, and (3) combined lesion and ischemic (Methods). The Fisher test was performed on overlapping gene sets, the p-values shown represent the Fischer test (two-tailed) p-values and error bars represent 95% confidence intervals. Data represent Mean ± SEM. Source data
Extended Data Fig. 7
Extended Data Fig. 7. Relative gene expression of PLVAP and FAM110D in human aortic ECs.
a) Relative gene expression of PLVAP and FAM110D in Telo-HAECs and HAECs compared to control lentivirus transduced cells. The qPCR was performed in four replicates. Data represent Mean ± SEM. Source data
Extended Data Fig. 8
Extended Data Fig. 8. Cell painting to identify phenotypic features associated with the FAM110D and PLVAP overexpression.
Over 300 basic morphology, STAR morphology, SER texture and Haralick features were measured from fluorescent stained samples of LV-FAM110D and LV-PLVAP overexpressing HAEC cells. Source data

References

    1. Bjorkegren, J. L. M. & Lusis, A. J. Atherosclerosis: recent developments. Cell185, 1630–1645 (2022). - PMC - PubMed
    1. Rexrode, K. M. et al. The impact of sex and gender on stroke. Circ. Res.130, 512–528 (2022). - PMC - PubMed
    1. Hosman, F. L., Engels, S., den Ruijter, H. M. & Exalto, L. G. Call to action for enhanced equity: racial/ethnic diversity and sex differences in stroke symptoms. Front. Cardiovasc. Med.9, 874239 (2022). - PMC - PubMed
    1. Depuydt, M. A. C. et al. Microanatomy of the human atherosclerotic plaque by single-cell transcriptomics. Circ. Res.127, 1437–1455 (2020). - PMC - PubMed
    1. Koplev, S. et al. A mechanistic framework for cardiometabolic and coronary artery diseases. Nat. Cardiovasc. Res.1, 85–100 (2022). - PMC - PubMed

Publication types

MeSH terms

LinkOut - more resources