The effect of aldafermin expressing-Escherichia coli Nissle 1917 along with dietary change on visceral adipose tissue in MASLD mouse model
- PMID: 40211057
- PMCID: PMC12283412
- DOI: 10.1038/s41366-025-01774-w
The effect of aldafermin expressing-Escherichia coli Nissle 1917 along with dietary change on visceral adipose tissue in MASLD mouse model
Abstract
Background: Visceral adipose tissue (VAT) accumulation in obesity has been implicated as a key factor in the development of metabolic dysfunction-associated steatotic liver disease (MASLD). Apart from lifestyle change interventions, there is no effective therapy against MASLD. In this study, the effect of a novel microbial therapy along with dietary change on VAT and VAT-liver crosstalk was evaluated in a MASLD mouse model.
Methods: MASLD was induced by feeding eighteen C57BL/6J male mice with the American Lifestyle-Induced Obesity diet for fourteen weeks. Subsequently, during the following seven weeks, all mice were switched to standard diet and the intervention group received single gelatine cubes containing 109 CFU each of aldafermin-expressing Escherichia coli Nissle (EcNA, n = 6); while the control groups received either 109 CFU/gelatine cube of non-modified Escherichia coli Nissle (EcN, n = 6) or gelatin cube with no treatment (CTRL, n = 6). The effect of EcNA on epididymal visceral adipose tissue (eVAT) morphology was evaluated by histology and the gene expression profile in eVAT and liver by RNA-sequencing analysis.
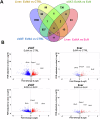
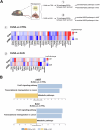
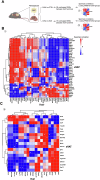
Results: After seven weeks of intervention, EcNA, when compared to CTRL group, induced smaller adipocytes (p-value = 0.0217 for diameter, p-value = 0.0386 for area). Gene Set Enrichment Analysis in eVAT showed significant upregulation of fatty acid metabolism (FDR-adjusted p-value = 0.001), oxidative phosphorylation (FDR-adjusted p-value < 2.2e-16), peroxisome (FDR-adjusted p-value = 0.0185), and thermogenesis (FDR-adjusted p-value = 0.0199) pathways when EcNA was compared to EcN group. In addition, the impact of EcNA in eVAT-liver gene expression crosstalk was underlined by the upregulation of Bcl6 and Cnst expression in both tissues when EcNA was compared to CTRL and EcN groups.
Conclusions: These results support the beneficial effects of EcNA, along with dietary change intervention, in obesity-associated MASLD. This microbial therapy could potentially boost the improvements induced by dietary change in eVAT metabolism and its crosstalk with the liver.
© 2025. The Author(s).
Conflict of interest statement
Competing interests: M.O.A.S., R.V.U., V.I., C.G.G., H.N., J.L., and M.K. are co-inventors of a patent related to the therapeutic effects of the engineered strain in MASLD (WO2023208816). The University of Eastern Finland and the Technical University of Denmark are co-owners of this patent. The remaining authors declare no conflicts of interest.
Figures


Similar articles
-
Advanced Microbiome Therapeutics Accelerate MASLD Recovery by Restoring Intestinal Microbiota Equilibrium and the Gut-Liver Axis in a Mouse Model.J Agric Food Chem. 2025 Jun 18;73(24):15199-15214. doi: 10.1021/acs.jafc.5c01674. Epub 2025 Jun 6. J Agric Food Chem. 2025. PMID: 40480642
-
Alisol B ameliorated metabolic dysfunction-associated steatotic liver disease via regulating purine metabolism and restoring the gut microbiota disorders.Phytomedicine. 2025 Sep;145:156992. doi: 10.1016/j.phymed.2025.156992. Epub 2025 Jun 22. Phytomedicine. 2025. PMID: 40582207
-
Adefovir dipivoxil and pegylated interferon alfa-2a for the treatment of chronic hepatitis B: a systematic review and economic evaluation.Health Technol Assess. 2006 Aug;10(28):iii-iv, xi-xiv, 1-183. doi: 10.3310/hta10280. Health Technol Assess. 2006. PMID: 16904047
-
Nutritional interventions for survivors of childhood cancer.Cochrane Database Syst Rev. 2016 Aug 22;2016(8):CD009678. doi: 10.1002/14651858.CD009678.pub2. Cochrane Database Syst Rev. 2016. PMID: 27545902 Free PMC article.
-
Physical exercise training interventions for children and young adults during and after treatment for childhood cancer.Cochrane Database Syst Rev. 2016 Mar 31;3(3):CD008796. doi: 10.1002/14651858.CD008796.pub3. Cochrane Database Syst Rev. 2016. PMID: 27030386 Free PMC article.
Cited by
-
Advanced Microbiome Therapeutics Accelerate MASLD Recovery by Restoring Intestinal Microbiota Equilibrium and the Gut-Liver Axis in a Mouse Model.J Agric Food Chem. 2025 Jun 18;73(24):15199-15214. doi: 10.1021/acs.jafc.5c01674. Epub 2025 Jun 6. J Agric Food Chem. 2025. PMID: 40480642
References
-
- Francque SMA, Dirinck E. NAFLD prevalence and severity in overweight and obese populations. Lancet Gastroenterol Hepatol. 2023;8:2–3. - PubMed
-
- Petta S, Amato MC, Di Marco V, Cammà C, Pizzolanti G, Barcellona MR, et al. Visceral adiposity index is associated with significant fibrosis in patients with non-alcoholic fatty liver disease: Visceral adiposity index and NAFLD. Aliment Pharmacol Ther. 2012;35:238–47. - PubMed
-
- Ha Y, Seo N, Shim JH, Kim SY, Park J, Han S, et al. Intimate association of visceral obesity with non-alcoholic fatty liver disease in healthy Asians: a case-control study. J Gastro Hepatol. 2015;30:1666–72. - PubMed
MeSH terms
LinkOut - more resources
Full Text Sources

