. 2025 May;27(5):776-789.
doi: 10.1038/s41556-025-01653-6. Epub 2025 Apr 10.

The bridge-like lipid transport protein VPS13C/PARK23 mediates ER-lysosome contacts following lysosome damage

Affiliations

The bridge-like lipid transport protein VPS13C/PARK23 mediates ER-lysosome contacts following lysosome damage

Xinbo Wang et al. Nat Cell Biol. 2025 May.

Abstract

Based on genetic studies, lysosome dysfunction is thought to play a pathogenetic role in Parkinson's disease. Here we show that VPS13C, a bridge-like lipid-transport protein and a Parkinson's disease gene, is a sensor of lysosome stress or damage. Following lysosome membrane perturbation, VPS13C rapidly relocates from the cytosol to the surface of lysosomes where it tethers their membranes to the ER. This recruitment depends on Rab7 and requires a signal at the damaged lysosome surface that releases an inhibited state of VPS13C, which hinders access of its VAB domain to lysosome-bound Rab7. Although another Parkinson's disease protein, LRRK2, is also recruited to stressed or damaged lysosomes, its recruitment occurs at much later stages and by different mechanisms. Given the role of VPS13 proteins in bulk lipid transport, these findings suggest that lipid delivery to lysosomes by VPS13C is part of an early protective response to lysosome damage.


Conflict of interest statement

Competing interests: P.D.C. is a member of the Scientific Advisory Board of Casma Therapeutics. The other authors declare no competing interests.

Figures

Fig. 1
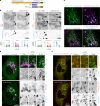
Fig. 1. VPS13C is acutely recruited to damaged lysosomes.
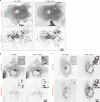
a, Domain organization of human VPS13C. b,c, Fluorescence image time series of live VPS13CmClover-Flp-In cells showing rapid VPS13C recruitment to damaged lysosomes following treatment with 1 mM LLOMe. c, Intensity of the punctate (top) and cytosolic (bottom) VPS13CmClover fluorescence per cell before and after treatment with 1 mM LLOMe is shown for a representative experiment; n = 21 cells were analysed. d, Intensity of punctate (top) and cytosolic (bottom) VPS13CmClover fluorescence per cell before and after treatment with 1 mM LLOMe for 14 min; n = 60 cells collected from three biological replicates. e, Fluorescence images of live VPS13CmClover-Flp-In cells co-expressing the lysosome marker Lamp1–RFP before and after treatment with 1 mM LLOMe. b,e, The experiments were repeated three times with similar results. f, Western blot analysis for the indicated proteins in whole cell lysates (left) and SPION-purified lysosomal fractions (right) of cells treated with 1 mM LLOMe or dimethylsulfoxide (DMSO) for 20 min. g, Quantification of the data in f. Bars show the normalized value relative to DMSO; n = 4 biological replicates; **P = 0.0013, ***P = 0.0004; a.u., arbitrary units. d,g, Error bars represent the s.d. h, Fluorescence image time series of live VPS13CmClover-Flp-In cells co-expressing mCh–Gal3 following treatment with 1 mM LLOMe. A merge field of the mClover and mCh fluorescence at 20 min is shown (right). Individual channel images of the dashed box are shown at the bottom. i, Intensity of the punctate fluorescence of VPS13CmClover and mCh–Gal3 in h before and after 1 mM LLOMe treatment; n = 58 VPS13C and 52 Gal3 cells collected from three biological replicates. c,i, Data are the normalized fluorescence relative to time 0 (LLOMe treatment start); mean ± s.d. represented by the solid line and shaded area, respectively. d,g, Data were compared using a two-sided Student’s t-test; **P < 0.01, ***P < 0.001, ****P < 0.0001. All the individual channel images in this figure are shown as inverted greys. Numerical source data and unprocessed blots are provided. Source data
Fig. 2
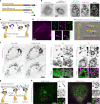
Fig. 2. VPS13C functions at the ER–endolysosome membrane contact sites.
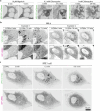
a, Cartoon depicting VPS13C localized at the ER–endolysosome membrane contact sites. b, High-magnification time-series images of VPS13CmClover-Flp-In cells co-expressing exogenous mCh–VAPB following treatment with 1 mM LLOMe. c, Fluorescence images of live VPS13CmClover-Flp-In cells showing VPS13CmClover localization in control (siControl, control siRNA) and Rab7-knockdown (siRab7, siRNA to Rab7) cells before and after treatment with 1 mM LLOMe (top). Fluorescence intensity of VPS13CmClover puncta signals per cell before and after LLOMe treatment (bottom). Error bars represent the s.d.; n = 44 siControl and 60 siRab7 cells collected from three biological replicates. Data were compared using a two-sided Student’s t-test; NS, not significant (P = 0.7437) and ****P < 0.0001. d, Fluorescence images of live WT and Rab7-KO HeLa cells, expressing VPS13CHalo and labelled with LysoView 640 (a luminal marker of acidic lysosomes), before and after treatment with 1 mM LLOMe. Black lines represent cell outlines. Magnified views of the boxed regions in the VPS13CHalo channel are shown (bottom). b,d, The experiments were repeated three times with similar results. All the individual channel images in this figure are shown as inverted greys. Numerical source data are provided. Source data
Fig. 3
Fig. 3. Rapid Rab7 phosphorylation induced by LLOMe is unnecessary for VPS13C recruitment.
a,b, Western blot analysis of the indicated proteins in whole-cell lysates of VPS13CmClover-Flp-In cells at different time points after treatment with 1 mM LLOMe (left). Protein quantification (right). The bars show normalized values relative to time 0; n = 2 (a) and 3 (b) biological replicates. b, Subsets of cells were transfected with mScarlet–PPM1H. c, Fluorescence images of live VPS13CmClover-Flp-In cells with mScarlet–PPM1H co-expression before and after treatment with 1 mM LLOMe. Cells not expressing mScarlet–PPM1H are outlined by dashed lines. d, Western blots for total Rab7 and Ser72-phosphorylated Rab7 (tubulin was used as a loading control) of whole-cell lysates of VPS13CmClover-Flp-In cells co-expressing constitutively kinase-active (mScarlet–LRRK1K746G) or kinase-dead (mScarlet-LRRK1D1409A) LRRK1 mutants (top). Protein quantification (bottom). The bars show normalized values relative to the signal obtained with kinase-dead LRRK1; n = 3 biological replicates. a,b,d, The error bars represent the s.d. e, Fluorescence images of live VPS13CmClover-Flp-In cells with co-expression of the constitutively kinase-active LRRK1 mutant (mScarlet-LRRK1K746G) before and after treatment with 1 mM LLOMe. Cells not expressing mScarlet–LRRK1K746G are outlined by dashed lines. f, Schematic of the iLID light-dependent protein heterodimeric system used in g. g, Fluorescence images of live VPS13CmClover-Flp-In cells with co-expression of exogenous Lamp1–mCh-iLID (bait) and Halo–SspB-PPM1H (prey) before and after blue light illumination and treatment with 1 mM LLOMe. Dashed lines represent cell outlines. c,e,g, The experiments were repeated three times with similar results. pS72, phosphorylation of Rab7 at Ser72. All the individual channel images in this figure are shown as inverted greys. Numerical source data and unprocessed blots are provided. Source data
Fig. 4
Fig. 4. An intramolecular regulation controls access of full-length VPS13C to Rab7.
a, Domain organization of full-length VPS13C. Deletion constructs used for the experiments of this figure are also indicated. b, Fluorescence images of live VPS13CmClover-Flp-In cells with co-expression of the mCh–VAB domain (top left) or mCh–VPS13CC-ter (top right), and labelled with LysoView 640, before and after treatment with 1 mM LLOMe. Levels of the punctate fluorescence from individual channels in a representative experiment (bottom). Each line represents the average intensity of the indicated signals from the same cell before and after LLOMe treatment; n = 20 cells were analysed. c, High-magnification fluorescence images of live VPS13CmClover-Flp-In cells with co-expression of mCh–VAB 20 min after the addition of 1 mM LLOMe. Almost no overlap between mCh–VAB and VPS13CmClover fluorescence was observed. d,e, Fluorescence images of live RPE1 cells co-expressing exogenous VPS13CHalo and either mCh–VAB (d) or mCh–VPS13CC-ter (e) before and after treatment with 1 mM LLOMe. Time series of individual channels from the boxed regions are shown (right). be, Blue (b) and grey (ce) dashed lines in the images represent cell outlines. The experiments were repeated three times with similar results. Numerical source data are provided. Source data
Fig. 5
Fig. 5. The ATG2C domain of VPS13C detects lysosome-membrane damage.
a, Domain organization of full-length VPS13C (top) as well as the domains of VPS13C used for the experiments of this figure (bottom). b, Fluorescence images of live RPE1 cells expressing full-length VPS13CHalo or VPS13C-Δ(ATG2C-PH)Halo under basal conditions (left). Magnified view of a region of a RPE1 cells showing co-localization of VPS13C-Δ(ATG2C-PH)Halo with Lamp1–GFP (right). c, Cartoon depicting the proposed association of VPS13C and its deletion constructs with Rab7 on the surface of lysosomes. d, Fluorescence image of live RPE1 cells expressing mCh-ATG2CVPS13C labelled with LysoView 640 and LipidSpot 488 (a lipid droplet marker; right). Magnified views of the boxed region are provided (right). e, Predicted structure of the ATG2C domain of VPS13C based on AlphaFold3 (left) and high-power views of the amphipathic helices (right). f, Fluorescence images of live RPE1 cells expressing mCh–ATG2CVPS13C before and after treatment with 1 mM LLOMe (left). Boxed regions are shown at higher magnification demonstrating co-localization of mCh-ATG2CVPS13C with Lamp1–GFP after LLOMe treatment (right). g, Putative model illustrating how binding of the ATG2CVPS13C domain to the bilayer may release an auto-inhibitory conformation of VPS13C to allow its binding to Rab7 on lysosomal surfaces. h, Fluorescence images of live RPE1 cells expressing mCh–ATG2CVPS13C and GFP–OSBP after treatment with 1 mM LLOMe (left) or 20 nM OSW1 (right). Grey dashed lines in the images represent cell outlines. Insets: magnified views of the boxed regions. f,h, Lipid droplets are labelled with asterisks. b,d,f,h, The experiments were repeated three times with similar results.
Fig. 6
Fig. 6. Loss of VPS13C increases the fragility of lysosomes.
a,b, Intensity of punctate LAMP1 immunofluorescence (a) and LysoView 633 fluorescence (a pH-sensitive lysosome probe; b) per WT and VPS13C-KO A549 cell. a, n = 240 cells per group. b, n = 84 WT and 76 VPS13C-KO cells. c,d, Gal3-to-LAMP1 ratio (c) determined from the images in d. c, Normalized fluorescence relative to WT cells treated with LLOMe for 25 min. NS, P = 0.2886; n = 32 (WT, 0 min; WT, 5 min; and VPS13C-KO, 5 min), 33 (VPS13C-KO, 0 min), 34 (WT, 15 min), 31 (VPS13C-KO, 15 min), 39 (WT, 25 min) and 35 (VPS13C-KO, 25 min) images analysing >300 cells. d, The images depict fluorescence microscopy of WT and VPS13C-KO A549 cells immunolabelled with antibodies to Gal3 and LAMP1 following treatment with or without 1 mM LLOMe for the indicated times. Fluorescence images from a representative experiment. ac, Three biological replicates. Data are the mean ± s.d. Data were compared using a two-sided Student’s t-test; ****P < 0.0001; NS, not significant. Numerical data are provided. Source data
Fig. 7
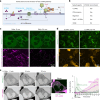
Fig. 7. Relationship between VPS13C and LRRK2 recruitment to damaged lysosomes.
a, Schematic illustration of the CASM pathway and experimental manipulations that trigger (blue) or inhibit (red) it. b, Summary of agents tested and their impact on the recruitment of VPS13C to lysosomes. c, Fluorescence images of live VPS13CmClover-Flp-In cells, labelled with LysoView 633, before and after Salip treatment. Dashed lines represent cell outlines. d, Fluorescence images of live VPS13CmClover-Flp-In cells with exogenous mCh–SopF co-expression before and after treatment with 1 mM LLOMe. Cells not expressing mCh–SopF are outlined by dashed lines. e, Time-series fluorescence images of live HeLa cells co-expressing VPS13CHalo and GFP–LRRK2 showing recruitment of VPS13C and LRRK2 to lysosomes following treatment with 1 mM LLOMe (left). Individual channel images are shown as inverted greys. Relative punctate fluorescence intensity of VPS13CHalo and GFP–LRRK2 per cell after LLOMe treatment in a single experiment (right). Mean ± s.d. represented by the solid line and shaded area, respectively; n = 15 VPS13C and 11 LRRK2 cells were analysed. ce, The experiments were repeated three times with similar results. Further examples in Extended Data Fig. 10b,c. Numerical source data are provided. Source data
Extended Data Fig. 1
Extended Data Fig. 1. Validation of the VPS13C^mClover-Flp-In cell line under the control of tetracycline and effect of the cathepsin C inhibitor E64D on VPS13C recruitment to endolysosomes.
a, Schematic drawing showing the experimental system used for the inducible stable expression of VPS13C^mClover. b, Western blots for the indicated proteins of whole cell lysates from VPS13C^mClover-Flp-In cells under the control of tetracycline, with or without tetracycline (0.1 μg/ml) treatment for 24 hours. Tubulin was used as a loading control. The experiment was repeated three times with similar results. c, Live fluorescence images of VPS13C^mClover-Flp-In cells before and after a 10 min exposure to 1 mM LLOMe with and without the additional presence of the cathepsin inhibitor E64d (200 μM). The experiment was repeated three times with similar results. Quantification of the intensity of the VPS13C^mClover punctate fluorescence per cell from a representative experiment is shown on the right. n = 20 cells (Control or E64D) were analysed. Graph shows the normalized fluorescence relative to time 0. Data were compared using two-sided t-tests. Error bars represent ±SD. **represent P = 0.0029, P = 0.0065 and P = 0.0057, respectively. Numerical data and unprocessed blots are provided. Source data
Extended Data Fig. 2
Extended Data Fig. 2. LLOMe-induced lysosomal recruitment of VPS13C precedes of ESCRT-III.
a, Time-series of live fluorescence images of VPS13C^mClover-Flp-In cells also co-expressing IST1-Apple, upon 1 mM LLOMe treatment. Note the delayed recruitment of IST1 to lysosomes relative to VPS13C. Individual channel images are shown as inverted greys. The experiment was repeated three times with similar results. b, Live fluorescence images of VPS13C^mClover-Flp-In cells also co-expressing IST1-Apple, 20 minutes after addition of 1 mM LLOMe. Cells were pre-incubated for 1 hr with or without the calcium chelator BAPTA (20 μM). Recruitment of IST1, but not of VPS13C, is inhibited by BAPTA. The experiment was repeated three times with similar results.
Extended Data Fig. 3
Extended Data Fig. 3. Validation of the Rab7 knockdown or knockout cells.
a, Anti-Rab7 western blot of whole cell lysates from control or Rab7 knockdown VPS13C^mClover-Flp-In cells. GAPDH as a loading control. b, Anti-Rab7 or anti-VPS13C western blots of whole cell lysates from WT or Rab7 knockout Hela cells. Tubulin as a loading control. c, Quantifications of the blots in b. Bars show the normalized value relative to WT. Error bars represent ±SD. n = 4 biological replicates. Numerical data and unprocessed blots are provided. Source data
Extended Data Fig. 4
Extended Data Fig. 4. Effect of the KO of LRRK1 and TBK1 on LLOMe-induced Rab7 Ser72 phosphorylation in mouse embryonic fibroblasts (MEFs).
Western blot analysis for the indicated proteins in whole cell lysates from the WT, LRRK1 KO or TBK1/IKKe DKO mouse embryonic fibroblasts treated with 1 mM LLOMe for the indicated times. Quantification of the data is shown on the right. n = 2 biological replicates. Numerical data and unprocessed blots are provided. Source data
Extended Data Fig. 5
Extended Data Fig. 5. Differential lysosome binding of the VAB domain alone and of the entire C-terminal fragment of VPS13C (VPS13CC-ter).
a, Live fluorescence images of WT or Rab7 KO Hela cells expressing mCherry-VAB and labelled with LysoView 640 under basal conditions. Boxed regions are shown on the right. b, Live fluorescence images of RPE1 cells expressing exogenous mCherry-VAB (left) or mCherry-VPS13CC-ter (right) before and after 1 mM LLOMe treatment. c, Live fluorescence images show localizations of mCherry-VAB or mCherry-VPS13CC-ter in VPS13C^mClover-Flp-In cells (left) or in RPE1 cells (right) in the absence of LLOMe treatment. Note the more prominent lysosome localization of the VAB domain relative to VPS13CC-ter. Individual channel images are shown as inverted greys. Experiments were repeated three times with similar results.
Extended Data Fig. 6
Extended Data Fig. 6. Impact of either LLOMe or OSW1 on the localization of the ATG2C domain or the PH domain of VPS13C.
a, Live fluorescence images of RPE1 cells expressing mCherry-PH and LAMP1-GFP before and after 1 mM LLOMe addition. b,c, Live fluorescence images of RPE1 cells expressing mCherry-ATG2CVPS13C and GFP-OSBP before and after addition of 20 nM OSW1 (b) or 1 mM LLOMe (c). Black dots visible before LLOMe are lipid droplets that move slightly in position after LLOMe. Individual channel images are shown as inverted greys. Experiments were repeated three times with similar results.
Extended Data Fig. 7
Extended Data Fig. 7. Impact of either LLOMe or OSW1 on the localization of VPS13C or OSBP.
a, Time-series of live fluorescence images of VPS13C^mClover-Flp-In cells also co-expressing exogenous mCherry-OSBP, upon 20 nM OSW-1 treatment to induce PI4P accumulation on endolysosomes. Individual channel images are shown as inverted greys. Note that the recruitment of OSBP is not accompanied by the recruitment of VPS13C. b, Time-series of live fluorescence images of VPS13C^mClover-Flp-In cells also co-expressing exogenous mCherry-OSBP, upon 1 mM LLOMe treatment. Note the delayed recruitment of OSBP to lysosomes relative to VPS13C. Individual channel images are shown as inverted greys. Boxed regions are shown at the bottom. Individual channel images are shown as inverted greys. Experiments were repeated three times with similar results.
Extended Data Fig. 8
Extended Data Fig. 8. Depletion of VPS13C does not affect the lysosomal recruitment of OSBP and IST1.
a, Anti-VPS13C western blot of whole cell lysates from WT or VPS13C knockout A549 cells. Tubulin was used as a loading control. b,c, Live fluorescence images of the WT and VPS13C-KO A549 cells expressing mCherry-OSBP and LAMP1-GFP (b) or IST1-Apple and LAMP1-GFP (c) and stained with LysoView640 before and after 1 mM LLOMe treatment. Individual channel images are shown as inverted greys. Experiments were repeated three times with similar results. Unprocessed blots are provided. Source data
Extended Data Fig. 9
Extended Data Fig. 9. Depletion of VPS13C causes disruption of lysosome homeostasis.
a, Anti-LAMP1 immunofluorescence of WT or VPS13C-KO A549 cells. b, Live fluorescence images of WT or VPS13C-KO A549 cells incubated with the pH sensitive LysoView633 showing lower fluorescence (higher pH) of the KO cells. c, Time-series of live fluorescence images of WT or VPS13C-KO Hela cells expressing Gal3-GFP showing recruitment of Gal3 to damaged lysosomes upon 1 mM LLOMe treatment. Quantification of the intensity of the Gal3-GFP punctate fluorescence per cell after addition of 1 mM LLOMe is shown on the right. n = 66 cells (WT), n = 81 cells (VPS13C-KO) collected from three biological replicates. Shaded areas, mean ± SD. Individual channel images are shown as inverted greys. Experiments were repeated three times with similar results. Numerical data are provided. Source data
Extended Data Fig. 10
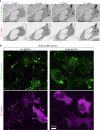
Extended Data Fig. 10. Effect of various agents on lysosomal recruitment of VPS13C or LRRK2.
a, Live fluorescence images of VPS13C^mClover-Flp-In cells before and after addition of nigericin or chloroquine, showing lysosomal recruitment of VPS13C. b, Time-series of live fluorescence images of Hela cells co-expressing VPS13C^Halo and GFP-LRRK2, showing recruitment of VPS13C and LRRK2 to lysosomes upon 1 mM LLOMe treatment. c, Time-series of live fluorescence images of a RPE1 cell co-expressing VPS13C^Halo and GFP-LRRK2 showing recruitment of VPS13C and LRRK2 to damaged lysosomes upon 1 mM LLOMe treatment. LRRK2 is recruited only to a small subset of lysosomes and with a much slower time course than VPS13C. Individual channel images are shown as inverted greys. Experiments were repeated three times with similar results.

Update of

References

    1. Lesage, S. et al. Loss of VPS13C function in autosomal-recessive Parkinsonism causes mitochondrial dysfunction and increases PINK1/Parkin-dependent mitophagy. Am. J. Hum. Genet.98, 500–513 (2016). - PMC - PubMed
    1. Darvish, H. et al. Identification of a large homozygous VPS13C deletion in a patient with early-onset Parkinsonism. Mov. Disord.33, 1968–1970 (2018). - PMC - PubMed
    1. Schormair, B. et al. Diagnostic exome sequencing in early-onset Parkinson’s disease confirms VPS13C as a rare cause of autosomal-recessive Parkinson’s disease. Clin. Genet.93, 603–612 (2018). - PubMed
    1. Braschi, B., Bruford, E. A., Cavanagh, A. T., Neuman, S. D. & Bashirullah, A. The bridge-like lipid transfer protein (BLTP) gene group: introducing new nomenclature based on structural homology indicating shared function. Hum. Genomics16, 66 (2022). - PMC - PubMed
    1. Neuman, S. D., Levine, T. P. & Bashirullah, A. A novel superfamily of bridge-like lipid transfer proteins. Trends Cell Biol.32, 962–974 (2022). - PMC - PubMed

MeSH terms

LinkOut - more resources