. 2025 Apr 10;25(1):459.
doi: 10.1186/s12870-025-06100-0.

Diurnal rhythms in durum wheat triggered by Rhopalosiphum padi (bird cherry-oat aphid)

Affiliations

Diurnal rhythms in durum wheat triggered by Rhopalosiphum padi (bird cherry-oat aphid)

Yoshiahu Goldstein et al. BMC Plant Biol. .

Abstract

Wheat is a staple crop and one of the most widely consumed grains globally. Wheat yields can experience significant losses due to the damaging effects of herbivore infestation. However, little is known about the effect aphids have on the natural diurnal rhythms in plants. Our time-series transcriptomics and metabolomics study reveals intriguing molecular changes occurring in plant diurnal rhythmicity upon aphid infestation. Under control conditions, 15,366 out of the 66,559 genes in the tetraploid wheat cultivar Svevo, representing approximately 25% of the transcriptome, exhibited diurnal rhythmicity. Upon aphid infestation, 5,682 genes lost their rhythmicity, while 5,203 genes began to exhibit diurnal rhythmicity. The aphid-induced rhythmic genes were enriched in GO terms associated with plant defense, such as protein phosphorylation and cellular response to ABA and were enriched with motifs of the WRKY transcription factor families. In contrast, the genes that lost rhythmicity due to aphid infestation were enriched with motifs of the TCP and ERF transcription factor families. While the core circadian clock genes maintain their rhythmicity during infestation, we observed that approximately 60% of rhythmic genes experience disruptions in their rhythms during aphid infestation. These changes can influence both the plant's growth and development processes as well as defense responses. Furthermore, analysis of rhythmic metabolite composition revealed that several monoterpenoids gained rhythmic activity under infestation, while saccharides retained their rhythmic patterns. Our findings highlight the ability of insect infestation to disrupt the natural diurnal cycles in plants, expanding our knowledge of the complex interactions between plants and insects.

Keywords: Rhopalosiphum padi; Aphid; Diurnal; Rhythmicity; Transcription factor; Transcriptomics; Untargeted metabolomics; WRKY; Wheat.


Conflict of interest statement

Declarations. Ethics approval and consent to participate: Not applicable. Consent for publication: Not applicable. Competing interests: The authors declare no competing interests.

Figures

Fig. 1
Fig. 1
Experimental design and exploratory data analysis. (a) The experimental design was as follows: Svevo plants were infested with R. padi aphids at zt4 (12:00). Every 4 h, samples were collected from both infested and control plants, with aphids gently swept off the leaves prior to collection. Samples were immediately frozen with liquid nitrogen and stored in -80 °C for future processing. Four samples were collected for RNA-seq and six for untargeted metabolomics. (b) A PCA plot of control condition RNA-seq results was created using normalized expression levels with MetaboAnalyst, applying a 25% Interquartile Range (IQR) filter and Auto-scaling. Overall, PC1 has 32.5% and PC2 has 26.5% variance. Timepoints follow a clockwise position, with the first sampling collected at 12:00 on the first day in close proximity to the last sample collected at 12:00 on the second day. (c) A PCA plot of aphid-infested condition genes was created using normalized expression levels with MetaboAnalyst. Overall, PC1 has 37.9% and PC2 has 25% variance. Timepoints follow a clockwise position, with distance between the first and last sampling
Fig. 2
Fig. 2
Classification of Svevo genes and metabolites into different rhythmic groups. (a) Division of Svevo genes into different rhythmic groups. Rhythmic detection was performed separately for control and aphid conditions using the Metacycle R package, with a corrected P-value cutoff of 0.05. Genes were grouped into those shared between both conditions and those unique to either control or aphid conditions, labeled as ‘Shared’, ‘Unique Control’, and ‘Unique Aphid’, respectively. Shared genes were further divided into those that maintained their rhythmic pattern and those that exhibited a shift, labeled as ‘Conserved Pattern’ and ‘Pattern Shift’, respectively. Finally, conserved pattern genes were split into differentially expressed under aphid infestation and uniformly expressed genes, labeled as ‘Conserved Pattern DE’ and ‘Conserved Pattern UE’, respectively. Differential expression analysis was conducted using DESeq2 with a corrected P-value cutoff of 0.05. (b) The number of rhythmic genes found in each of the different rhythmic groups. (c) Venn diagrams showing the number of rhythmic features detected in the control and aphid conditions, analyzed using untargeted metabolomics. Each diagram displays the number of rhythmic features in the ‘Unique Control’, ‘Shared’, and ‘Unique Aphid’ rhythmic groups, with positive and negative ion samples processed separately. Rhythmic detection was performed on the MS1 data obtained from LC-MS
Fig. 3
Fig. 3
Rhythmic metabolites putative classification. Pie charts showing putative metabolite classification for the ‘Unique Control’, ‘Shared’, and ‘Unique Aphid’ rhythmic groups. Identification was performed on the MS2 data obtained from LC-MS using the CANOPUS tool within Sirius. Metabolites are classified by their Natural Product Compound (NPC) superclass family, as determined by NPClassifer
Fig. 4
Fig. 4
Gene Ontology (GO) term enrichment of different rhythmic gene groups. GO term enrichment of the different rhythmic groups was performed using the genes found in each group. The analysis was conducted on gProfiler using the Triticum turgidum genome from Ensembl Plants as reference, with a BH-FDR cutoff of 0.05. Shown are the top 10 most significant GO terms for Biological Processes (green) and Molecular Functions (blue). The different rhythmic groups and their GO terms are: (a) Unique Control, (b) Unique Aphid, (c) Conserved Pattern, (d) Pattern Shift, (e) Conserved Pattern Uniformly Expressed, and (f) Conserved Pattern Differentially Expressed rhythmic groups. The symbol “/“ stands for “hydrolase activity, acting on”
Fig. 5
Fig. 5
Transcription factor family enrichment for the different rhythmic groups. Transcription factor (TF) enrichment analysis was performed for all identified rhythmic groups. Gene TFs were first identified using the PlantTFDB TF prediction tool. Then, for each identified TF family, enrichment was tested for each rhythmic group, using all identified TF as background. Enrichment was observed only for the ‘Shared’, ‘Conserved Pattern’, ‘Conserved Pattern DE’ and ‘Conserved Pattern UE’ groups. Log2 odds ratios are provided to show overrepresented and underrepresented TF families. A Fisher’s exact test followed by Benjamin-Hochberg (BH) correction with a 0.05 cutoff was used to determine enrichment
Fig. 6
Fig. 6
Rhythmic patterns of WGCNA clusters under control and aphid conditions. Rhythmic genes were clustered using WGCNA, applied separately to aphid and control conditions. Eight clusters were identified for the control condition and eleven clusters for the aphid condition. Shown here is the gene expression level of the top six clusters (those with the most abundant number of genes) for the (a) control and (b) aphid-infestation conditions. Gene expression levels were normalized with DESeq2 and then VST transformed prior to clustering. Each grey line represents a single gene and red lines indicate the cluster’s average. All gene clusters with corresponding genes can be found in Table S9
Fig. 7
Fig. 7
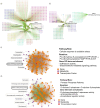
TF-gene and TF-gene-metabolite correlation networks. (a)-(b) Hub TF-gene correlation networks were created for the ‘Unique Control’ and ‘Unique Aphid’ groups. First, transcription factors belonging to the ‘Unique Control’ and ‘Unique Aphid’ groups were identified. Among these, hub TF genes were selected based on having the highest module membership in the different clusters (Table S9) identified using WGCNA. PCC co-expression networks were then created using the CoExpNetViz Cytoscape plug-in, correlating these hub TFs and rhythmic genes. Only networks with corresponding GO term enrichment (Table S10) for the identified correlated genes are shown. Nodes represent correlated genes and edges represent correlations, with green indicating a positive correlation and red indicating a negative correlation. Genes are grouped into their PLAZA family. (a) Hub TF and gene correlation network for the ‘Unique Control’ rhythmic group. (b) Hub TF and gene correlation network for the ‘Unique Aphid’ rhythmic group. (c)-(d) Hub TF-gene-metabolite PCC networks were created. The TFs and genes identified from the hub TF-gene CoExpNetViz correlation network were selected. These, together with the rhythmic metabolites in the ‘Unique Aphid’ and ‘Unique Control’ conditions, were used to create the networks. PCC networks were created using the ExpressionCorrelation Cytoscape plug-in. GO enrichment of the correlated genes was performed in gProfiler. Green edges indicate a positive correlation while red edges indicate a negative correlation. Two networks were created, one for (c) the C2H2 (TRITD4Av1G015190) of the ‘Unique Control’ group and the other for (d) the WRKY (TRITD3Av1G210740) of the ‘Unique Aphid’ rhythmic group

Similar articles

References

    1. Nozue K, Maloof JN. Diurnal regulation of plant growth. Plant Cell Environ. 2006;29. - PubMed
    1. McClung CR. Plant circadian rhythms. Plant Cell. 2006;18. - PMC - PubMed
    1. Roden LC, Ingle RA. Lights, rhythms, infection: the role of light and the circadian clock in determining the outcome of plant-pathogen interactions. Plant Cell. 2009;21. - PMC - PubMed
    1. Erenstein O, Jaleta M, Mottaleb KA, Sonder K, Donovan J, Braun H-J. Global trends in Wheat Production, Consumption and Trade. In: Reynolds MP, Braun H-J, editors. Wheat improvement: Food Security in a changing climate. Cham: Springer International Publishing; 2022. pp. 47–66.
    1. Sun H, Zhang W, Wu Y, Gao L, Cui F, Zhao C et al. The circadian clock gene, TaPRR1, is Associated with Yield-related traits in wheat (Triticum aestivum L). Front Plant Sci. 2020;11. - PMC - PubMed

LinkOut - more resources