. 2025 Apr 10;23(1):421.
doi: 10.1186/s12967-025-06361-1.

Vorinostat impairs the cancer-driving potential of leukemia-secreted extracellular vesicles

Affiliations

Vorinostat impairs the cancer-driving potential of leukemia-secreted extracellular vesicles

Crescenzo Massaro et al. J Transl Med. .

Abstract

Background: Leukemia-secreted extracellular vesicles (EVs) carry biologically active cargo that promotes cancer-supportive mechanisms, including aberrant proliferative signaling, immune escape, and drug resistance. However, how antineoplastic drugs affect EV secretion and cargo sorting remains underexplored.

Methods: Leukemia-secreted extracellular vesicles (EVs) were isolated by Differential UltraCentrifugation, and their miRNome and proteomic profiling cargo were analyzed following treatment with SAHA (Vorinostat) in Acute Myeloid Leukemia (AML) and Chronic Myeloid Leukemia (CML). The epigenetic modulation of leukemia-secreted EVs content on interesting key target molecules was validated, and their differential functional impact on cellular viability, cell cycle progression, apoptosis, and tumorigenicity was assessed.

Results: SAHA significantly alters the cargo of Leukemia-derived EVs, including miR-194-5p and its target BCLAF1 (mRNA and protein), key regulators of Leukemia cell survival and differentiation. SAHA upregulates miR-194-5p expression while selective loading BCLAF1 into EVs, reducing the miRNA levels in the same compartment. Additionally, SAHA alters miRNA profile and proteomic composition associated with leukemic EVs, altering their tumor-supportive potential, with differential effects observed between AML and CML. Furthermore, in silico predictions suggest that these modified EVs may influence cell sensitivity to antineoplastic agents, suggesting a dual role for SAHA in impairing oncogenic signaling while enhancing therapeutic responsiveness.

Conclusions: In conclusion, the capacity of SAHA to modulate secretion and molecular composition of Leukemia-secreted EVs, alongside its direct cytotoxic effects, underscores its potential in combination therapies aimed to overcoming refractory phenotype by targeting EV-mediated communication.

Keywords: Epigenetics; Extracellular vesicles; Leukemia; SAHA; Tumorigenicity.


Conflict of interest statement

Declarations. Ethics approval and consent to participate: Not applicable. Consent for publication: All authors have read and agreed to the published version of the manuscript. Competing interests: The authors declare no competing interests.

Figures

Fig. 1
Fig. 1
Characterization of leukemia-derived EVs and SAHA affects leukemia EV-associated miRNA profile. A Top, transmission electron microscopy micrographs of EVs isolated from U937 cells. Scale bar, 100 nm; Bottom, CD63, CD9, and Tsg101 analysis by immunoelectron microscopy in EVs isolated from U937 cells; B Western blot for CD63 and cytochrome C in U937 and K562 cells and corresponding EVs; C Left, SAHA-induced effect on EV secretion in U937 cells assessed by FACS; Right, SAHA induced effect on EV secretion in K562 cells assessed by FACS. Data were normalized to viable cell count and conditioned medium volume and expressed as fold change relative to the experimental control. Error bars indicate standard deviation; D Heat map of differentially expressed miRNAs in EVs derived from untreated vs SAHA-treated cells (Supplementary Table 1 shows the miRNA list); E Venn diagram of miRNAs carried by EVs derived from untreated vs SAHA-treated cells; F miR-194-5p sorting in U937 EVs modulated by SAHA expressed as SAHA mean. Error bars indicate standard deviation
Fig. 2
Fig. 2
BCLAF1 quantification in leukemic cells and related EVs. A BCLAF1 and EV marker expression in U937 cells and cognate vesicles after 24 h SAHA treatment. Top left, BCLAF1mRNA quantification in U937 cells normalized to GAPDH expression; Bottom left, BCLAF1 protein quantification normalized to tubulin expression and CD63 expression in U937 cells with or without SAHA; Top right, BCLAF1mRNA quantification in U937-derived EVs normalized to Y-RNA; Bottom right, BCLAF1 and EV-associated marker quantification in U937-derived EVs; B BCLAF1 expression in K562 cells after 24 h SAHA treatment. Top left, mRNA quantification in K562 cells normalized to GAPDH mRNA expression; Bottom left, protein quantification normalized to β-actin and CD63 expression in K562 cells treated with or without SAHA; Top right, bclaf1mRNA quantification in K562-derived EVs normalized to Y-RNA; Bottom right, BCLAF1 and EV-associated marker quantification in K562-derived EVs. Error bars indicate standard deviation; C Immunofluorescence-based co-staining of BCLAF1 and CD63 (with DAPI for nucleus staining) in U937 cells untreated or treated with SAHA; D BCLAF1 and CD63 co-staining in K562 cells untreated or treated with SAHA; 40X magnification; E FACS-based quantification of BCLAF1-positive vesicles in EVs derived from SAHA treated vs untreated U937 cells. Data were normalized to viable cells and conditioned medium volume. Results are expressed as percentage of BCLAF1 + EVs to the total number of events. Error bars indicate standard deviation
Fig. 3
Fig. 3
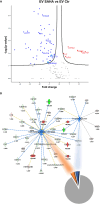
SAHA-induced changes in AML EV content and resulting biological functions predicted to be inhibited in recipient cells. A Volcano plot showing differentially loaded proteins in AML EVs upon SAHA treatment. Proteins most detected in EV SAHA compared to EV Ctr are in red; proteins less detected in the SAHA group compared to related Ctr are in blue. Proteins involved in drug resistance are circled (ACTG1, fold change = − 0.76; HSP90AA1, fold change = − 1.13); B Ingenuity Pathway Analysis showing functions predicted to be modulated in recipient cells by U937 EVs. Bottom, pie chart of all functions predicted to be modulated by the vesicle groups. Functions not significantly modulated in the comparison between EV SAHA vs EV Ctr are in gray. Functions predicted to be significantly inhibited in EV SAHA are in orange (“Cell viability of tumor cell lines”, 4.3%) and blue (“Invasion of tumor”, 4.3%). Top, proteins involved in the reported functions. The function “Invasion of tumor” showed a p-value of 6.5 × 10–6 and z-score of − 2.155. The function “Cell viability of tumor cell lines” showed a p-value of 1.10 × 10–9 and z-score of − 2.391. Activation z-score £ − 2 means the function is inhibited; z-score ≥ + 2 means the function is induced
Fig. 4
Fig. 4
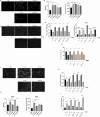
Tumorigenic capability, drug resistance and molecular delivery induced by EV SAHA in U937 and K562. A Images acquired with Cytation of U937 colony formation upon treatment with PBS, LV Ctr, LV SAHA, SV Ctr, and SV SAHA; B Left, number of newly formed colonies (per cm2); Right, area of the colonies (indicated as pixel density). Error bars indicate standard deviation; C Left, BCLAF1mRNA yield in U937 cells exposed to EVs from different sources and subsequently untreated or treated with SAHA (5 µM at 24 h), normalized to GAPDH expression; Right, miR-194-5p yield in U937 cells exposed to EVs from different sources and subsequently untreated or treated with SAHA (5 µM at 24 h), normalized to RNU6 expression; D Survival and tumorigenic capability of U937 cells pretreated with EVs from different sources followed by SAHA treatment (5 µM at 24 h). Images acquired with Agilent BioTek Cytation 5; E Propidium Iodide-based evaluation of cell survival following SAHA treatment induced by EVs from different sources. Error bars indicate standard deviation; F Images acquired with Cytation of K562 colony formation upon treatment with PBS, LV Ctr, LV SAHA, SV Ctr, and SV SAHA; G Left, number of newly formed colonies (per cm2); Right, area of the colonies (indicated as pixel density). Error bars indicate standard deviation; H BCLAF1mRNA yield in K562 cells exposed to EVs from different sources and subsequently untreated or treated with SAHA (5 µM at 24 h), normalized to GAPDH expression; I miR-194-5p yield in K562 cellsexposed to EVs from different sources and subsequently untreated or treated with SAHA (5 µM at 24 h), normalized to RNU6 expression

References

    1. Byrd JC, Mrozek K, Dodge RK, Carroll AJ, Edwards CG, Arthur DC, et al. Pretreatment cytogenetic abnormalities are predictive of induction success, cumulative incidence of relapse, and overall survival in adult patients with de novo acute myeloid leukemia: results from Cancer and Leukemia Group B (CALGB 8461). Blood. 2002;100(13):4325–36. - PubMed
    1. Ayala F, Dewar R, Kieran M, Kalluri R. Contribution of bone microenvironment to leukemogenesis and leukemia progression. Leukemia. 2009;23(12):2233–41. - PMC - PubMed
    1. van der Pol E, Boing AN, Harrison P, Sturk A, Nieuwland R. Classification, functions, and clinical relevance of extracellular vesicles. Pharmacol Rev. 2012;64(3):676–705. - PubMed
    1. Doyle LM, Wang MZ. Overview of extracellular vesicles, their origin, composition, purpose, and methods for exosome isolation and analysis. Cells. 2019;8(7):727. - PMC - PubMed
    1. Takov K, Yellon DM, Davidson SM. Comparison of small extracellular vesicles isolated from plasma by ultracentrifugation or size-exclusion chromatography: yield, purity and functional potential. J Extracell Vesicles. 2019;8(1):1560809. - PMC - PubMed

MeSH terms

LinkOut - more resources