. 2025 Apr 10;44(1):117.
doi: 10.1186/s13046-025-03380-0.

Reduction of alternative polarization of macrophages by short-term activated hepatic stellate cell-derived small extracellular vesicles

Affiliations

Reduction of alternative polarization of macrophages by short-term activated hepatic stellate cell-derived small extracellular vesicles

Yufeng Sun et al. J Exp Clin Cancer Res. .

Abstract

Background: Activated hepatic stellate cells (HSCs) induce alternative (M2) polarization of macrophages and contribute to the progression of fibrosis and hepatocellular carcinoma (HCC). However, the effects of small extracellular vesicles released by HSCs (HSC-sEVs) during activation remain largely unknown.

Methods: The aim of this study was to investigate the role of extracellular vesicles released by HSCs (HSC-sEVs) at different stages of activation in macrophage polarization. The effects of sEVs from short-term activated and long-term activated HSCs on liver macrophages was studied. Small RNA sequencing analyses were performed to obtain differential miRNAs transported by the short-term and long-term activated HSC- sEVs. The in vivo effects of short-term activated HSC-sEV-specific miRNA on liver macrophage and liver fibrosis were confirmed in a CCl4-induced liver injury mouse model. To study the tumor suppressive effects of the macrophages educated by short-term activated HSC-sEV-specific miRNA, human hepatoma cells were mixed and subcutaneously cotransplanted with miR-99a-5p mimic-pretreated macrophages.

Results: We found that consistent with activated HSCs, long-term activated HSC-sEVs (14dHSC-sEVs) induce bone marrow-derived monocytes (MOs) toward an M2 phenotype, but short-term activated HSC-sEVs (3dHSC-sEVs) induce the resident macrophages (Kupffer cells, KCs) toward a classically activated (M1) phenotype. We identified five 3dHSC-sEV-specific miRNAs, including miR-99a-5p. In vitro and in vivo experiments support that miR-99a-5p negatively regulates alternative polarization of macrophages, decreases collagen deposition in chronic liver injury model, and suppresses the progression of hepatoma in a xenograft model partially by targeting CD93.

Conclusion: Collectively, our work reveals an unexpected proinflammatory role of 3dHSC-sEVs, preliminarily explores the underlying mechanism, and evaluates the therapeutic potential of 3dHSC-sEV-specific miR-99a-5p for liver fibrosis and tumorigenesis.


Conflict of interest statement

Declarations. Ethics approval and consent to participate: Not applicable. Consent for publication: Not applicable. Competing interests: The authors declare no competing interests.

Figures
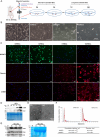
Fig. 1
Fig. 1
Characterization of culture-activated primary rat HSCs and sEVs isolated from the culture media. (A) Schematic representation of the process for rat primary hepatic stellate cell isolation and culture. (B) Morphology of primary hepatic stellate cells of rats at Day 0, Day 3, Day 7 and Day 14, bright field, scale bar = 200 μm. (C) BODIPY 493/503 staining of cytoplasmic lipid droplets and immunofluorescence staining of Desmin and α-smooth muscle actin (α-SMA) of HSCs at the indicated time points. BODIPY 493/503 (green), Desmin and α-SMA (Cy3, red), nuclei were counterstained with DAPI (blue), scale bar = 50 μm. (D) Western blotting analyses of the HSC activation markers, α-SMA and collagen type I (ColI). Cells were collected at the indicated time points. Coomassie blue staining was used as a loading control. (E) Transmission electron microscopy image of the particles isolated from the primary HSC culture medium. Left, sEVs enriched by the ExoQuick Kit; right, sEVs enriched by ultracentrifugation (UC), scale bar = 200 nm. (F) Representative size distribution of isolated particles and their concentrations determined by nanoparticle tracking analyses. (G) The expression of CD63, CD81 and CD9 in the isolated particles detected by western blotting. Coomassie blue staining was used as a loading control. sEV, small extracellular vesicle; 3dHSCs, primary hepatic stellate cells cultured on Day 3; and 14dHSCs, primary hepatic stellate cells cultured on Day 14
Fig. 2
Fig. 2
The effects of short-term activated HSC (3dHSC)- and long-term activated HSC (14dHSC)-derived conditioned medium (CM) and sEVs on liver macrophage (KC). (A) Morphology of HSC-sEV-cocultured KCs. Gene expression profiles of 3dHSC- and 14dHSC-sEV-treated KCs were obtained by RNA-Seq. (B) Principal component analyses (PCA) based on the gene expression profiles of 3dHSC- and 14dHSC-derived sEV-treated liver resident macrophages as well as untreated KCs obtained by RNA-Seq. Each dot represents one RNA-Seq dataset of primary cells from one rat. (C) A heatmap was generated on the set of 388 differentially expressed genes between the 3dHSC- and 14dHSC-sEV-treated KCs. Representative genes are listed on the right side (P value < 0.05 and fold change > 2.0 or fold change < 0.5). The scale represents normalized log2 gene expression levels. (D) The gene expression levels of key macrophage biomarkers in KCs cocultured with 3dHSC- or 14dHSC-sEVs were determined by RT-qPCR using the same batch of samples used in RNA-Seq. (E) The protein expression of INOS and CD206 in KCs cocultured with 3dHSC- or 14dHSC-sEVs was detected by western blotting. (F) Surface marker expression in KCs cocultured with 3dHSC- or 14dHSC-sEVs was determined by flow cytometry. (G) The major biological activities for the 388 differentially expressed genes between 3dHSC- and 14dHSC-sEV-cocultured KCs are provided as a summary graph by Ingenuity Pathways Analysis. Orange, activated in KC3dE; blue, inhibited in KC3dE. (H) Upstream regulators of the 388 differentially expressed genes between 3dHSC- and 14dHSC-sEV-cocultured KCs. Red, activated KCs cocultured with 3dHSC-sEVs; green, activated KCs cocultured with 14dHSC-sEVs (p < 0.05 and activation z score > 2 or < -2). Statistical significance was determined by Student’s t test relative to untreated KCs, *** p < 0.001, ** p < 0.01, * p < 0.05; and Student’s t test relative to 3dHSC-sEV-cocultured KCs, ### p < 0.001, ## p < 0.01, # p < 0.05
Fig. 3
Fig. 3
The effects of short-term activated HSC (3dHSC)- and long-term activated HSC (14dHSC)-derived conditioned medium (CM) and sEVs on bone marrow-derived monocyte (MO) differentiation. Primary rat MOs were cocultured with 3dHSC- and 14dHSC-CM or sEVs; untreated cells served as controls. (A) Morphology of HSC-sEV-cocultured MOs, scale bar = 100 μm. (B) Principal component analysis (PCA) based on the gene expression profiles of 3dHSC- and 14dHSC-sEV-treated MOs as well as untreated MOs obtained by RNA-Seq. Each dot represents one RNA-Seq dataset of primary cells from one rat. (C) Heatmaps were generated on a set of 28 representative genes that were differentially expressed between 3dHSC- and 14dHSC-derived sEV-treated Kupffer cells (KCs), as listed in Fig. 2C (P value < 0.05 and fold change > 2.0 or fold change < 0.5); red, highly expressed in 3dHSC-sEV-cocultured KCs; green, highly expressed in 14dHSC-sEV-cocultured KCs. Each row represents an individual gene, and each column represents an individual sample. The scale represents normalized log2 gene expression levels. (D) The gene expression levels of key macrophage biomarkers in MOs cocultured with 3dHSC- or 14dHSC-sEVs were determined by RT‒qPCR using the same batch of samples in RNA-Seq. The relative gene expression levels were normalized to β-Actin and untreated MOs. (E) The protein expression of INOS and CD206 in MOs cocultured with 3dHSC- or 14dHSC-sEVs was detected by western blotting. (F) Surface marker expression in MOs cocultured with 3dHSC- or 14dHSC-sEVs was determined by flow cytometry. Statistical significance was determined by Student’s t test relative to untreated MOs, *** p < 0.001, ** p < 0.01, * p < 0.05; Student’s t test relative to 3dHSC-sEV-cocultured MOs, ### p < 0.001, ## p < 0.01, # p < 0.05, ns, not significant
Fig. 4
Fig. 4
The miRNA profiling and validation of short-term activated HSCs (3dHSCs) and long-term activated HSCs (14dHSCs) and corresponding sEVs. (A) Heatmap generated with DeSeq2 software packages showing the Euclidean distances between the samples. (B) Correlation of normalized reads (log2TPM) obtained by small RNA-Seq and adjusted RT-qPCR CT values for 15 miRNAs (rno-let-7f-5p, rno-miR-10a-5p, rno-miR-125a-5p, rno-miR-125b-1-3p, rno-miR-127-3p, rno-miR-139-5p, rno-miR-143-3p, rno-miR-146b-5p, rno-miR-27a-3p, rno-miR-27b-3p, rno-miR-30a-5p, rno-miR-30b-5p, rno-miR-423-5p, rno-miR-486, and rno-miR-99a-5p). RT-qPCR was performed with the same batch of RNAs prepared for sequencing. The relative expression levels of the selected miRNAs as determined by qPCR were expressed as adjusted Ct (ΔCt + 15) for cell samples and as (ΔCt + 25) for sEV samples. U6snRNA served as the reference gene for cell samples, and spike-in cel-miR-39 served as the reference gene for sEV samples. (C) Venn diagram showing the common and unique miRNAs identified in HSCs and HSC sEVs; the differentially expressed miRNAs between 3dHSCs and 14dHSCs and those between the corresponding sEVs were compared; only those miRNAs with a base mean > 100 were included (Table S6). The 12 miRNAs expressed differentially in either HSCs or the corresponding sEVs upon activation are listed on the right side; the up- or downregulation of these miRNAs is indicated by an upward red arrow or downward green arrow. (D) The expression of miR-99a-5p, miR-139-5p, and miR-221-3p in sEVs from culture-activated rat primary HSCs and the TGF-β-activated human hepatic stellate cell line LX2 was determined by RT-qPCR, and spike-in cel-miR-39 served as a reference. The relative expression of miRNA was expressed as adjusted Ct (40 - Ct), and statistical significance was determined by Student’s t test, *** p < 0.001, ** p < 0.01, * p < 0.05, ns, not significant. (E) Overall survival analyses of miR-99a-5p, miR-139-5p, and miR-221-3p expression in HCC patients based on TCGA survival data, and a 33rd percentile cutoff was adopted
Fig. 5
Fig. 5
The effects of short-term activated HSC-sEV-specific miR-99a-5p on primary rat liver macrophage (KC) and human THP-1 macrophage differentiation. (A, E) The expression of miR-99a-5p and the mRNAs of 8 genes associated with HSC-sEV-induced macrophage differentiation in miR-99a-5p mimic-treated primary rat KCs (A) and human THP-1 macrophages (E) was determined by RT-qPCR. The relative miR-99a-5p expression was normalized to that of U6snRNA, and the relative gene expression was normalized to that of 18 S rRNA (or β-Actin) and then to miRNA mimic negative control (mimic-NC). Red font, highly expressed in 3dHSC-sEV cocultured KCs, green font, highly expressed in 14dHSC-sEV cocultured KCs. (B, F) Surface marker expression in miR-99a-5p mimic-treated primary rat KCs (B) and human THP-1 macrophages (F) was determined by flow cytometry. Representative flow cytometry images and statistical histograms for CD86- and CD206-positive cells in each group are provided. (C, G) The protein expression of INOS and CD206 in miR-99a-5p mimic-treated primary rat KCs (C) and human THP-1 macrophages (G) was detected by western blotting, β-Actin served as a loading control and was normalized to mimic-NC treated cells. (D, H) Cytokine array analyses for culture media from primary KCs (D) and human THP-1 macrophages (H) treated by miR-99a-5p mimic and control (mimic-NC). Inflammatory factors are listed on the right side. Each row represents an individual inflammatory factor, and each column represents an individual sample. Red font, proinflammatory factors; green font, anti- inflammatory factors. The scale represents normalized log2 inflammatory factor expression levels. Statistical significance was determined by Student’s t test, *** p < 0.001, ** p < 0.01, * p < 0.05
Fig. 6
Fig. 6
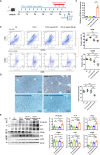
The effects of short-term activated HSC-sEV-specific miR-99a-5p on liver macrophage (KC) differentiation, inflammation and collagen deposition in a chronic liver injury mouse model. (A) Schematic representation of agomir-99a-5p treatment in a CCL4-induced chronic liver injury mouse model. (B) The expression of miR-99a-5p in KCs was determined by RT-qPCR and normalized to that of U6snRNA and to the miRNA agomir negative control (agomir-NC). (C) Surface marker expression in KCs gated on CD11b + F4/80 + primary liver mononuclear cells were determined by flow cytometry. Representative flow cytometry images and statistical histograms for CD86- and CD206-positive cells are provided. (D) Immunohistochemical staining of CD206 in liver tissue sections from each group. Representative images are provided, and positively stained cells are dark brown, scale bar = 100 μm. (E) The expression of NF-κB p65, IL-6, INOS, CD206, COLI, and α-SMA in the liver was detected by western blotting. β-Actin served as a loading control and was normalized to the mimic-NC treated group. Data from at least five mice for each group are presented as the mean ± SEM. Statistical significance was determined by one-way ANOVA, ***p < 0.001, **p < 0.01, *p < 0.05, ns, not significant
Fig. 7
Fig. 7
Short-term activated HSC-sEV-specific miR-99a-5p-educated macrophages suppressed the growth of hepatocellular carcinoma. THP-1 macrophages were pretreated with miR-99a-5p mimic or mimic negative control (mimic-NC) for 8 h. (A) Colony formation of Huh7 or HepG2 cells cocultured with miR-99a-5p mimic-pretreated THP-1 macrophages at a ratio of 5:1. (B) Nude mouse xenograft experiments. HepG2 cells were mixed and subcutaneously cotransplanted with miR-99a-5p mimic-pretreated THP-1 macrophages. The size of the tumor was measured at the indicated time points. The weight of the tumor was obtained on Day 28. (C) Immunohistochemical staining of Ki67 in paraffin sections of xenografts, scale bar = 100 μm. (D) The expression of CD206 and INOS in xenografts was detected by western blotting, β-Actin served as a loading control. For (A-D), the experiments performed with THP-1 macrophages pretreated with miRNA, mimic-NC served as a negative control. Representative images are provided. Data from at least three wells (A) or five mice (B-D) for each group were shown as the mean ± SEM. Statistical significance was determined by one-way ANOVA, ***p < 0.001, **p < 0.01, *p < 0.05, ns, not significant
Fig. 8
Fig. 8
Short-term activated HSC-sEV-specific miR-99a-5p might influence macrophage differentiation by targeting CD93. (A) Dual-luciferase assay for the interaction between miR-99a-5p and the 3’UTR of CD93 mRNA in 293T cells. (B) The effects of the miR-99a-5p mimic on CD93 expression in primary rat liver macrophages (KCs) and human THP-1 macrophages were measured by RT-qPCR and western blotting. (C) The effects of agomir-99a-5p on CD93 expression in CCl4-induced chronic liver injury mice were detected by western blotting. (D) Spearman correlation between the expression of CD93 and CD206 in human HCC tissues; correlation p value = 1.41e-21, correlation coefficient = 0.47. (E) The mRNA expression of genes associated with HSC-sEV-induced macrophage differentiation in siCD93 treated human THP-1 macrophages was determined by RT-qPCR. (F) The mRNA expression of genes associated with HSC-sEV-induced macrophage differentiation in OE-CD93 treated human THP-1 macrophages was determined by RT-qPCR. (G, H) Cytokine array analyses for culture media from human THP-1 macrophages (G) or primary KCs (H) treated by siCD93, OE-CD93 and corresponding NC. Inflammatory factors are listed on the right side. Each row represents an individual inflammatory factor, and each column represents an individual sample. The scale represents normalized log2 inflammatory factor expression levels. Red font, proinflammatory factors; green font; anti-inflammatory factors. (I) The protein expression of TNF-α and CD206 in miR-99a-5p mimic treated CD93 overexpression human THP-1 macrophages were detected by western blotting. The relative protein expression was normalized to β-actin, and then to OE-NC. Statistical significance was determined by Student’s t test. Compared to OE-NC, ***p < 0.001, **p < 0.01, *p < 0.05; compared to OE-CD93, #p < 0.05. WT, wild type; MT, mutated type; NC, negative control

Similar articles

References

    1. Sia D, Villanueva A, Friedman SL, Llovet JM. Liver cancer cell of origin, molecular class, and effects on patient prognosis. Gastroenterology. 2017;152(4):745–61. - PubMed
    1. Grivennikov SI, Greten FR, Karin M. Immunity, inflammation, and cancer. Cell. 2010;140(6):883–99. - PMC - PubMed
    1. Tarao K, Nozaki A, Ikeda T, Sato A, Komatsu H, Komatsu T, Taguri M, Tanaka K. Real impact of liver cirrhosis on the development of hepatocellular carcinoma in various liver diseases-meta-analytic assessment. Cancer Med-Us. 2019;8(3):1054–65. - PMC - PubMed
    1. Kim JW, Kim YJ. The evidence-based multifaceted roles of hepatic stellate cells in liver diseases: A concise review. Life Sci 2024;344:122547. - PubMed
    1. Friedman SL. Hepatic stellate cells: protean, multifunctional, and enigmatic cells of the liver. Physiol Rev. 2008;88(1):125–72. - PMC - PubMed

MeSH terms

LinkOut - more resources