. 2025 Jun;31(6):158.
doi: 10.3892/mmr.2025.13523. Epub 2025 Apr 11.

Role and mechanism of mitochondrial dysfunction‑related gene biomarkers in the progression of type 2 diabetes mellitus

Affiliations

Role and mechanism of mitochondrial dysfunction‑related gene biomarkers in the progression of type 2 diabetes mellitus

Mengxue Liu et al. Mol Med Rep. 2025 Jun.

Abstract

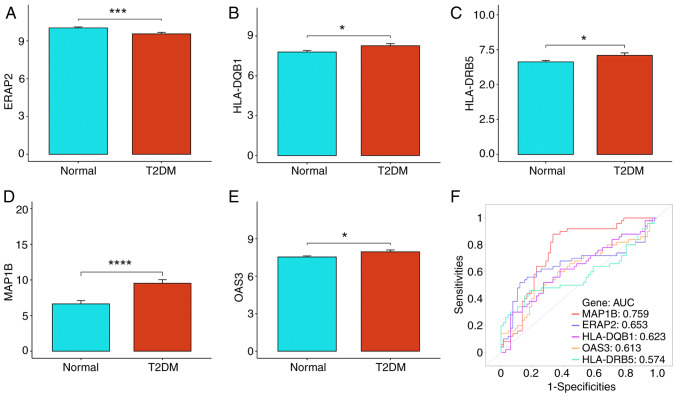
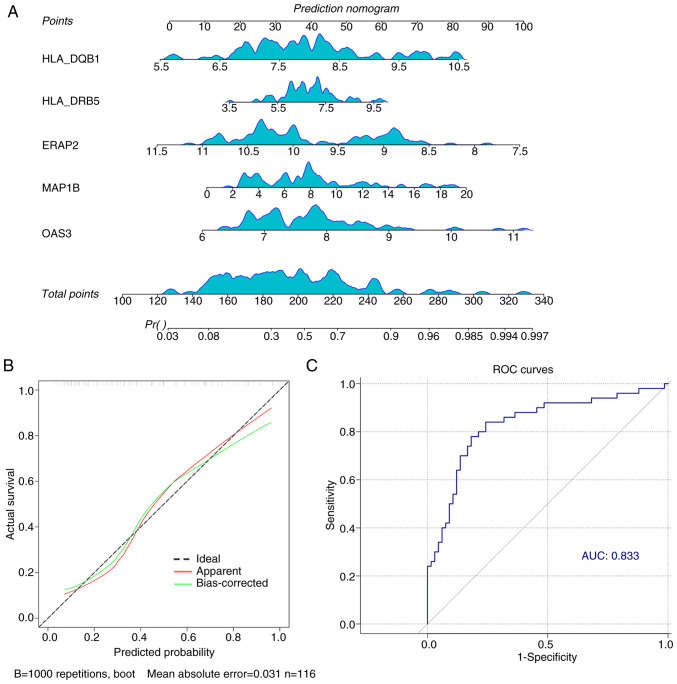
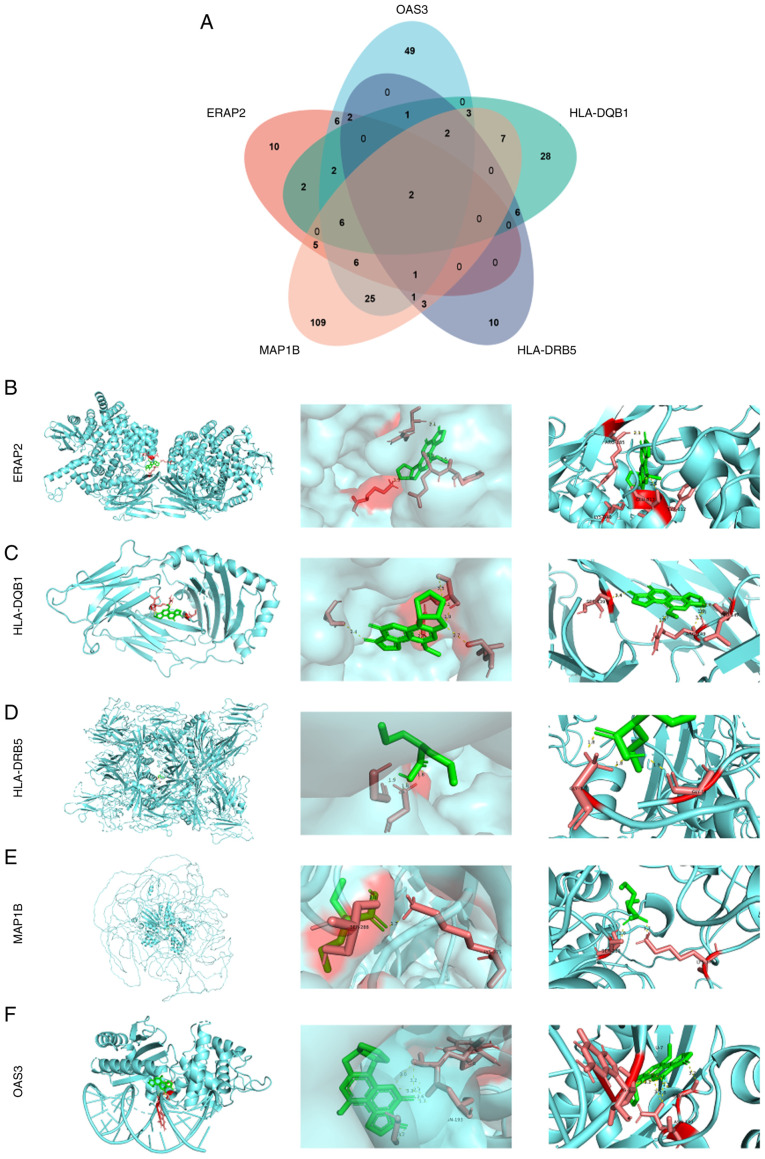
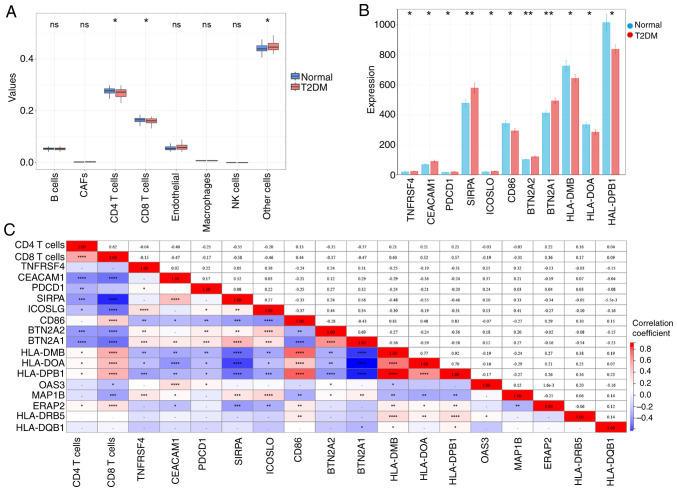
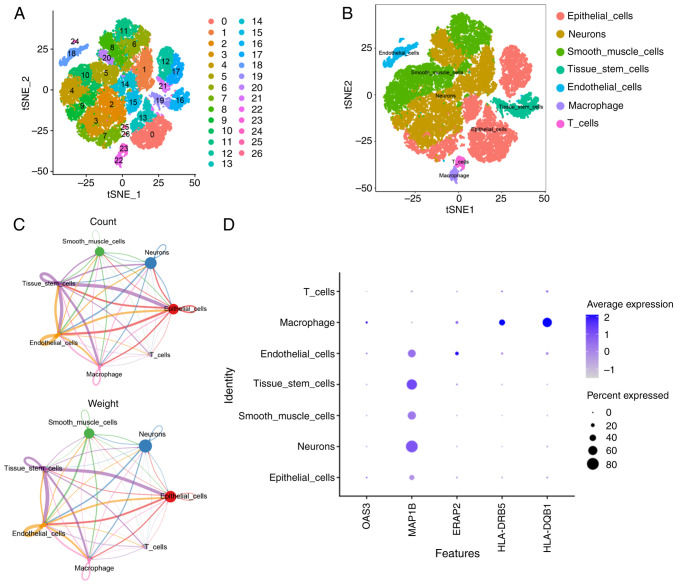
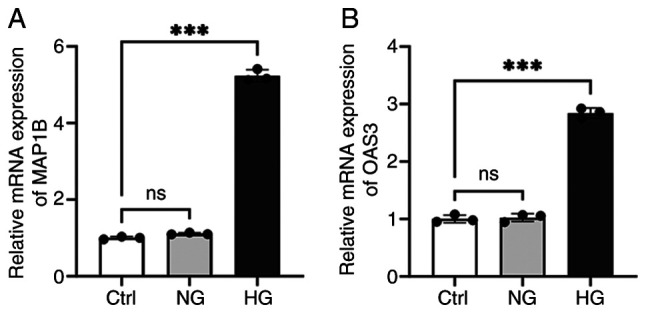
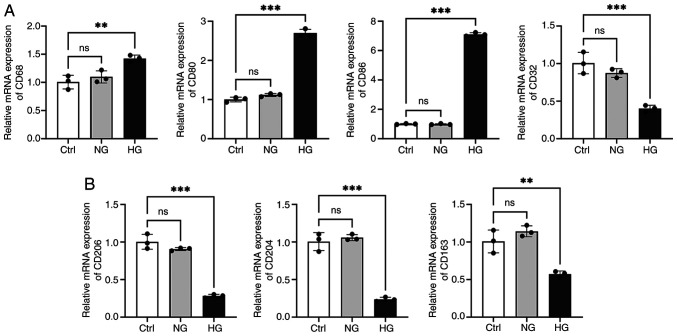
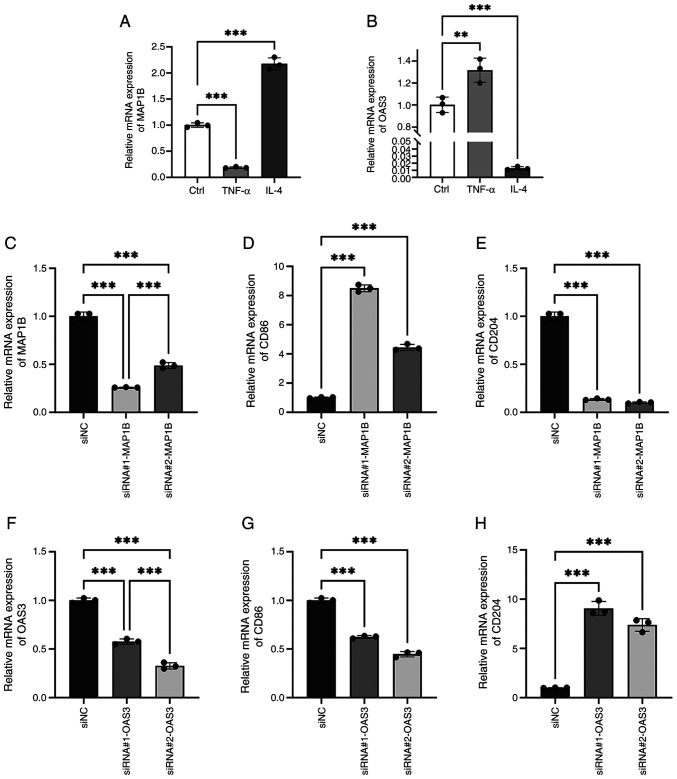
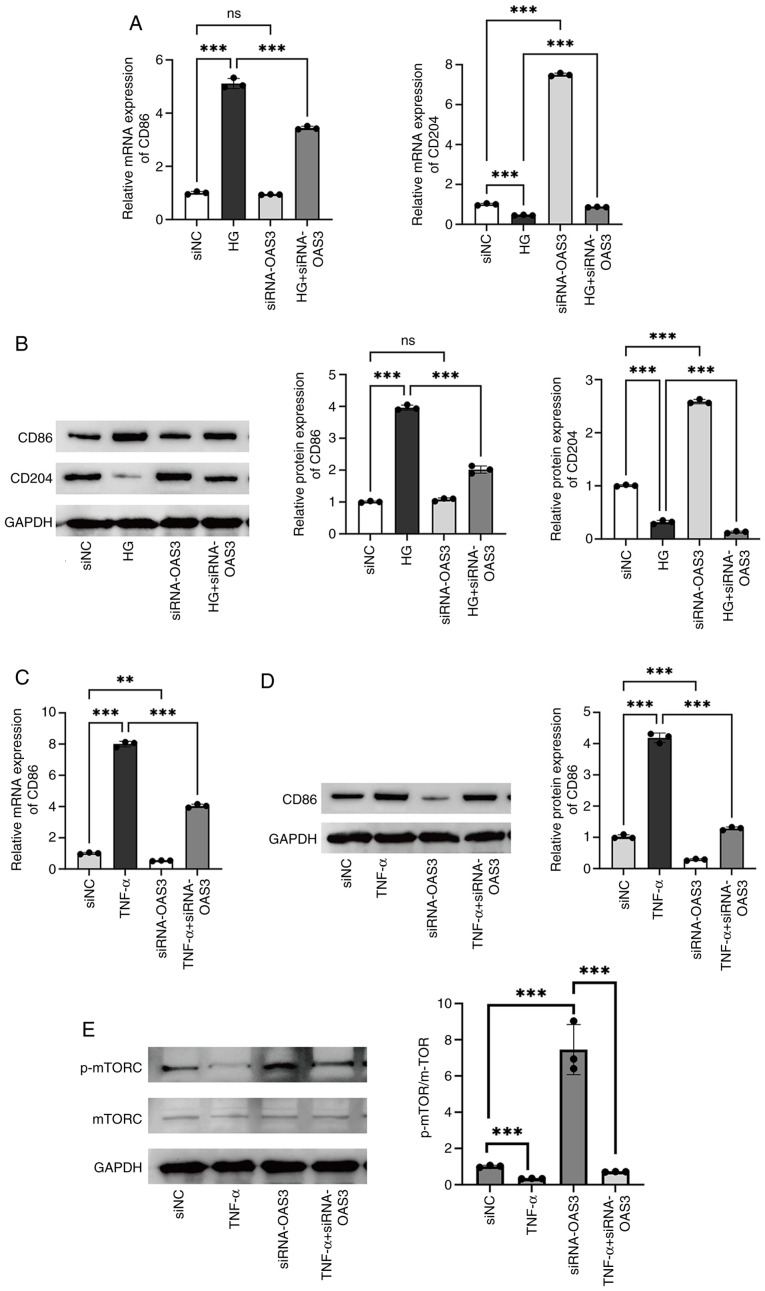
The present study aimed to elucidate the roles and mechanisms of gene biomarkers associated with mitochondrial dysfunction in the progression of Type 2 diabetes mellitus (T2DM). It conducted an analysis of differentially expressed genes related to mitochondrial dysfunction in T2DM and employed bioinformatics approaches to predict potential target drugs for key biomarkers. Additionally, the present study used the EPIC algorithm to examine immune cell infiltration in T2DM. Furthermore, the single‑cell RNA sequencing dataset GSE221156 was analyzed to identify specific cell types involved in T2DM. The expression of biomarkers was investigated through cellular experiments to assess the effect of marker genes on macrophage polarization. A total of five biomarker genes associated with T2DM were identified, namely ERAP2, HLA‑DQB1, HLA‑DRB5, MAP1B and OAS3. The combined detection of these genes yielded a risk‑predictive area under the curve value of 0.833 for T2DM. These five marker genes may serve as potential targets for valproic acid (VPA). During the progression of T2DM, there is an increase in macrophage numbers, with these genes being highly expressed in macrophages. In a high glucose‑induced RAW264.7 macrophage model, the expressions of MAP1B and OAS3 were upregulated. Notably, the knockdown of OAS3 markedly reduced M1 macrophage polarization, indicating OAS3 facilitates M1 macrophage polarization in a high‑glucose environment. The downregulation of OAS3 expression attenuated M1 macrophage polarization by inhibiting mTORC activation. In conclusion, five candidate biomarkers for T2DM were identified that may serve as therapeutic targets for VPA and are associated with immune infiltration in T2DM. Among these, OAS3 enhances M1 macrophage polarization in a high‑glucose environment by regulating the mTORC1 pathway.

Keywords: OAS3; macrophage polarization; mitochondrial dysfunction; type 2 diabetes; valproic acid.


Conflict of interest statement

The authors declare that they have no competing interests.

Figures

Figure 1.
Figure 1.
Identification of DEGs between T2DM and normal samples. The blue dots represent downregulated genes and the red dots represent upregulated genes. DEGs, differentially expressed genes; T2DM, type 2 diabetes mellitus.
Figure 2.
Figure 2.
Screening for mitochondrial dysfunction and intersection of T2DM-related genes. (A) Determination of appropriate soft thresholds based on scale independence and average connectivity. (B) Results of Pearson correlation analysis of 23 co-expression modules. (C) Results of correlation analysis between modules and traits in T2DM (blue: negative correlation, green: positive correlation). (D) Screening for mitochondrial dysfunction and intersection of T2DM-related genes. T2DM, type 2 diabetes mellitus.
Figure 3.
Figure 3.
Functional enrichment analysis of 65 key genes. The results of GO analysis demonstrated the key genes before their critical roles in (A) MF, (B) CC and (C) BP. (D) Results of KEGG analysis demonstrated the key genes' important pathways. GO, Gene Ontology; MF, molecular function; CC, cellular component; BP, biological process; KEGG, Kyoto Encyclopedia of Genes and Genomes.
Figure 4.
Figure 4.
Screening of biomarkers. (A) RF was used to screen biomarkers and rank the genes according to importance. (B) SVM was used to screen biomarkers. (C) Lasso logistic regression algorithm was used to screen biomarkers with different colors denoting different genes. (D) Venn diagrams was used to screen common potential biomarkers obtained from all three algorithms. RF, Random forest; SVM, support vector machine; Lasso, least absolute shrinkage and selection operator.
Figure 5.
Figure 5.
Expression and predictive efficacy analysis of biomarkers in T2DM. (A-E) Expression levels of five biomarkers in the normal and T2DM groups. (A) ERAP2, (B) HLA-DQB1, (C) HLA-DRB5, (D) MAP1B and (E) OAS3. (F) ROC curves of five biomarkers independently predicting efficacy in T2DM. *P<0.05, ***P<0.001 and ****P<0.0001. T2DM, type 2 diabetes mellitus; ERAP2, endoplasmic reticulum aminopeptidase 2; HLA, human leukocyte antigen; MAPIB, microtubule-associated protein 1B; OAS3, 2′-5′-oligoadenylate synthetases 3; ROC, receiver operating characteristic; AUC, area under the curve.
Figure 6.
Figure 6.
Analysis of the overall predictive efficacy of the five biomarkers. (A) A nomogram was constructed based on the five biomarkers. (B) The calibration curves were almost identical to the ideal curves. (C) ROC curve showing the overall prediction efficacy of the five marker genes. ROC, receiver operating characteristic; AUC, area under the curve; HLA, human leukocyte antigen; ERAP2, endoplasmic reticulum aminopeptidase 2; OAS3, 2′-5′-oligoadenylate synthetase 3.
Figure 7.
Figure 7.
Biomarker targeting compounds and molecular docking results of five biomarkers VPA. (A) Biomarker targeting compounds. (B) Docking site of VPA with ERAP2. (C) Docking site of VPA with HLA-DQB1; (D) Docking site of VPA with HLA-DRB5; (E) Docking site of VPA with MAPIB; (F) Docking site of VPA with OAS3. VPA, valproic acid; ERAP2, endoplasmic reticulum aminopeptidase 2; HLA, human leukocyte antigen; MAPIB, microtubule-associated protein 1B; OAS3, 2′-5′-oligoadenylate synthetases 3; ROC, receiver operating characteristic; AUC, area under the curve.
Figure 8.
Figure 8.
Correlation analysis of biomarkers with immune infiltration and immune checkpoint genes. (A) Analysis of immune infiltration; (B) Difference in expression of immune checkpoint genes in normal and T2DM groups; (C) Pearson correlation of immune cells, immune checkpoints and marker genes, with blue color indicating negative correlation and red color indicating positive correlation. *P<0.05, **P<0.01, ***P<0.001, ****P<0.0001.T2DM, type 2 diabetes mellitus; ns, no significant difference.
Figure 9.
Figure 9.
Analysis of cell types in T2DM based on single-cell sequencing data. (A) Cell populations identified by the GSE221156 dataset; (B) annotation of cell subpopulations. (C) Interaction diagram between cell types in 7. (D) Distribution of various cell types in normal, PD and T2DM samples. PD, prediabetic state; T2DM, type 2 diabetes mellitus; OAS3, 2′-5′-oligoadenylate synthetases; MAPIB, microtubule-associated protein 1B; ERAP2, endoplasmic reticulum aminopeptidase 2; HLA, human leukocyte antigen.
Figure 10.
Figure 10.
The expression levels of MAP1B and OAS3 were detected in RAW264.7 cells. (A) The expression of MAP1B was detected by RT-qPCR. (B) The expression of OAS3 was detected by RT-qPCR. ***P<0.001; ns, no significant difference. MAPIB, microtubule-associated protein 1B; OAS3, 2′-5′-oligoadenylate synthetases; RT-qPCR, reverse transcription-quantitative PCR; Ctrl, blank control group; NG, negative control group; HG, high glucose group.
Figure 11.
Figure 11.
Detection of M1 macrophage and M2 macrophage polarization in T2DM. (A) Detection of the expression of M1 macrophage markers CD68, CD80, CD86 and CD32. (B) Detection of the expression of M2 macrophage markers CD206, CD204 and CD163. **P<0.01; ***P<0.001; ns, no significant difference; T2DM, type 2 diabetes mellitus; Ctrl, blank control group; NG, negative control group; HG, high glucose group.
Figure 12.
Figure 12.
The effects of MAP1B and OAS3 on macrophage polarization. Detection of (A) MAP1B and (B) OAS3 n levels in TNF-α and IL-4 groups. RT-qPCR to detect the levels of (C) MAP1B, (D) CD86 and (E) CD204 following transfection of siRNA#1-MAP1B or siRNA#2-MAP1B. RT-qPCR to detect the expressions of (F) OAS3, (G) CD86 and (H) CD204 following transfection of siRNA#1-OAS3 or siRNA#2-OAS3; **P<0.01; ***P<0.001. MAPIB, microtubule-associated protein 1B; OAS3, 2′-5′-oligoadenylate synthetases; RT-qPCR, reverse transcription-quantitative PCR; siRNA, small interfering RNA; NC, negative control.
Figure 13.
Figure 13.
OAS3 modulates macrophage polarization markers (CD86/CD204) and mTOR signaling in type 2 diabetes mellitus models. (A) RT-qPCR to detect the levels of CD86 and CD204. (B) Western blotting to detect the protein expression levels of CD86 and CD204. (C) RT-qPCR to detect the expressions of CD86. (D) Western blotting to detect the protein expressions of CD86. (E) Protein expression levels of mTORC and p-mTORC were detected by western blotting; **P<0.01; ***P<0.001; ns: no significant difference. RT-qPCR, reverse transcription-quantitative PCR; siRNA, small interfering RNA; NC, negative control; MAPIB, microtubule-associated protein 1B; OAS3, 2′-5′-oligoadenylate synthetases; p-, phosphorylated.

References

    1. Diane A, Allouch A, Mu UMRBA, Al-Siddiqi HH. Endoplasmic reticulum stress in pancreatic β-cell dysfunctionality and diabetes mellitus: A promising target for generation of functional hPSC-derived β-cells in vitro. Front Endocrinol (Lausanne) 2024;15:1386471. doi: 10.3389/fendo.2024.1386471. - DOI - PMC - PubMed
    1. Ding Y, Shi Y, Guan R, Yan S, Liu H, Wang Z, Li J, Wang T, Cai W, Ma G. Evaluation and comparison of efficacy and safety of tirzepatide and semaglutide in patients with type 2 diabetes mellitus: A Bayesian network meta-analysis. Pharmacol Res. 2024;199:107031. doi: 10.1016/j.phrs.2023.107031. - DOI - PubMed
    1. Ye H, Wang R, Wei J, Wang Y, Zhang X, Wang L. Bioinformatics analysis identifies potential ferroptosis key gene in type 2 diabetic islet dysfunction. Front Endocrinol (Lausanne) 2022;13:904312. doi: 10.3389/fendo.2022.904312. - DOI - PMC - PubMed
    1. Zheng Y, Ley SH, Hu FB. Global aetiology and epidemiology of type 2 diabetes mellitus and its complications. Nat Rev Endocrinol. 2018;14:88–98. doi: 10.1038/nrendo.2017.151. - DOI - PubMed
    1. Sandoval DA, Patti ME. Glucose metabolism after bariatric surgery: Implications for T2DM remission and hypoglycaemia. Nat Rev Endocrinol. 2023;19:164–176. doi: 10.1038/s41574-022-00757-5. - DOI - PMC - PubMed