FLT3 ligand regulates expansion of regulatory T-cells induced by regulatory dendritic cells isolated from gut-associated lymphoid tissues through the Notch pathway
- PMID: 40211734
- PMCID: PMC12233934
- DOI: 10.1097/CM9.0000000000003493
FLT3 ligand regulates expansion of regulatory T-cells induced by regulatory dendritic cells isolated from gut-associated lymphoid tissues through the Notch pathway
Abstract
Background: Regulatory dendritic cell (DCreg) subset exhibits a unique capacity for inducing immune tolerance among the variety subsets of dendritic cells (DCs) within gut-associated lymphoid tissues (GALTs). Fms-like tyrosine kinase 3 ligand (FLT3L) is involved in the differentiation of DCregs and the subsequent expansion of regulatory T-cells (Tregs) mediated by DCregs, though the precise mechanism remains poorly understood. This study aimed to explore the expansion mechanism of Treg induced by DCreg and the role of FLT3L in this process.
Methods: DCregs were distinguished from other DC subsets isolated from GALTs of BALB/c mice through a mixed lymphocyte reaction assay. The functions and mechanisms by which FLT3L promoted Treg expansion via DCregs were investigated in vitro through co-culture experiments involving DCregs and either CD4 + CD25 - T-cells or CD4 + CD25 + T-cells. Additionally, an in vivo experiment was conducted using a dextran sulfate sodium (DSS)-induced colitis model in mice.
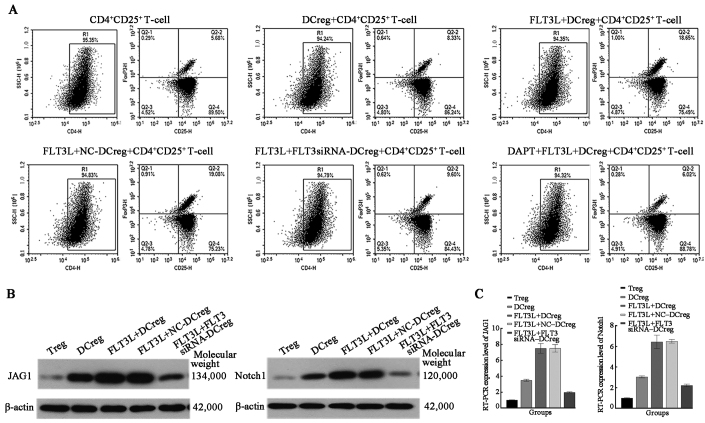
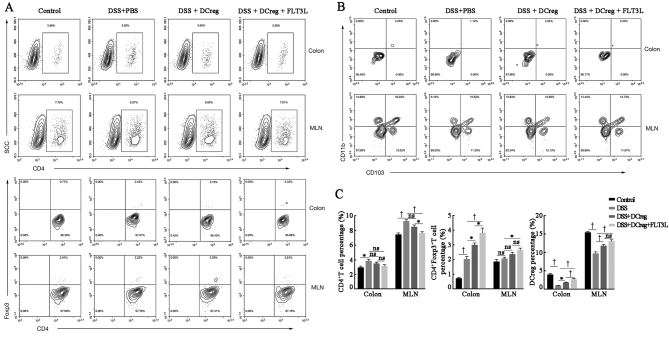
Results: CD103 + CD11b + DC exhibited DCreg-like functionality and was identified as DCreg for subsequent investigation. Analysis of Foxp3 + Treg percentages within a co-culture system of CD4 + CD25 - T-cells and DCregs, with or without FLT3L, demonstrated the involvement of the FLT3/FLT3L axis in driving the differentiation of precursor T-cells into Foxp3 + Tregs induced by DCregs. Cell migration and co-culture assays revealed that the FLT3/FLT3L axis enhanced DCreg migration toward Tregs via the Rho pathway. Additionally, it was observed that DCregs could promote Treg proliferation through the Notch pathway, as inhibition of Notch signaling by DAPT (N-[N-(3,5-difluorophenacetyl)-l-alanyl]-S-phenylglycine t-butyl ester) suppressed Treg expansion within the co-culture system of DCregs and CD4 + T-cells or CD4 + CD25 + T-cells. Furthermore, the FLT3/FLT3L axis influenced JAG1 expression in DCregs, indirectly modulating Treg expansion. In vivo experiments further established that FLT3L promoted DCreg expansion and restored Treg balance in DSS-induced colitis models, thereby ameliorating colitis symptoms in mice.
Conclusion: The FLT3/FLT3L axis is integral to the maintenance of DCreg function in Treg expansion.
Keywords: Dendritic cells; Fms-like tyrosine kinase 3 ligand; Jagged1; Notch1; Regulatory T-cells.
Copyright © 2025 The Chinese Medical Association, produced by Wolters Kluwer, Inc. under the CC-BY-NC-ND license.
Conflict of interest statement
None.
Figures


Similar articles
-
Trichinella spiralis adult excretory-secretory antigen promotes peripheral regulatory T cell differentiation and attenuates experimental colitis via TGF-β-like mechanisms.Parasit Vectors. 2025 Jul 1;18(1):240. doi: 10.1186/s13071-025-06877-x. Parasit Vectors. 2025. PMID: 40597393 Free PMC article.
-
cDC1s Promote Atherosclerosis via Local Immunity and Are Targetable for Therapy.Circ Res. 2025 Jul 18;137(3):400-416. doi: 10.1161/CIRCRESAHA.124.325792. Epub 2025 May 30. Circ Res. 2025. PMID: 40444360 Free PMC article.
-
Synergy between rapamycin and FLT3 ligand enhances plasmacytoid dendritic cell-dependent induction of CD4+CD25+FoxP3+ Treg.Blood. 2015 May 7;125(19):2937-47. doi: 10.1182/blood-2014-09-599266. Epub 2015 Apr 1. Blood. 2015. PMID: 25833958 Free PMC article.
-
Microbiota-dependent modulation of intestinal anti-inflammatory CD4+ T cell responses.Semin Immunopathol. 2025 Apr 1;47(1):23. doi: 10.1007/s00281-025-01049-6. Semin Immunopathol. 2025. PMID: 40167791 Review.
-
Role of the intestinal flora-immunity axis in the pathogenesis of rheumatoid arthritis-mechanisms regulating short-chain fatty acids and Th17/Treg homeostasis.Mol Biol Rep. 2025 Jun 21;52(1):617. doi: 10.1007/s11033-025-10714-w. Mol Biol Rep. 2025. PMID: 40544212 Review.
References
-
- Ramos MI, Tak PP, Lebre MC. Fms-like tyrosine kinase 3 ligand-dependent dendritic cells in autoimmune inflammation. Autoimmun Rev 2014;13:117–124. doi: 10.1016/j.autrev.2013.09.010. - PubMed
-
- Wilson KR, Villadangos JA, Mintern JD. Dendritic cell Flt3–Regulation, roles and repercussions for immunotherapy. Immunol Cell Biol 2021;99:962–971. doi: 10.1111/imcb.12484. - PubMed
-
- Swee LK, Bosco N, Malissen B, Ceredig R, Rolink A. Expansion of peripheral naturally occurring T regulatory cells by Fms-like tyrosine kinase 3 ligand treatment. Blood 2009;113:6277–6287. doi: 10.1182/blood-2008-06-161026. - PubMed
MeSH terms
Substances
LinkOut - more resources
Full Text Sources
Research Materials
Miscellaneous