Spatiotemporal trends in severe complicated influenza among the local population in Taiwan region, 2003-2023
- PMID: 40211816
- PMCID: PMC12178764
- DOI: 10.4178/epih.e2025016
Spatiotemporal trends in severe complicated influenza among the local population in Taiwan region, 2003-2023
Abstract
Objectives: Severe influenza has raised considerable concern worldwide, and its incidence appears to have shifted in the context of globalization. This study aimed to examine the temporal, spatial, and demographic distributions of local severe influenza cases in Taiwan region from January 2003 to June 2023.
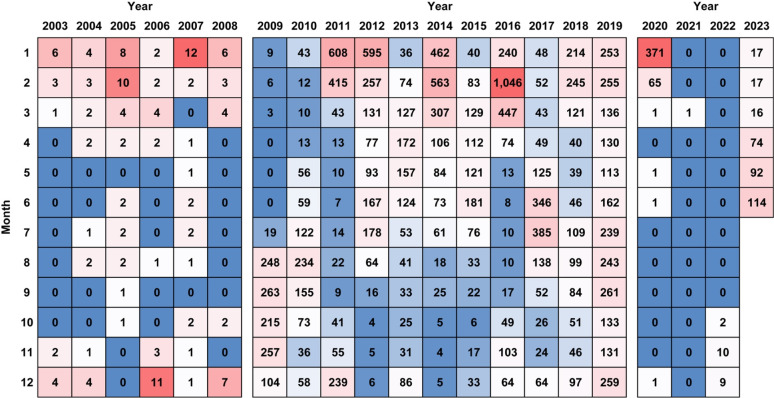
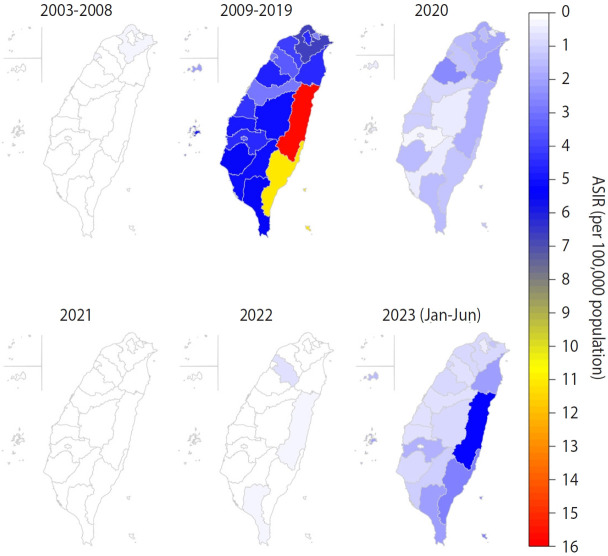
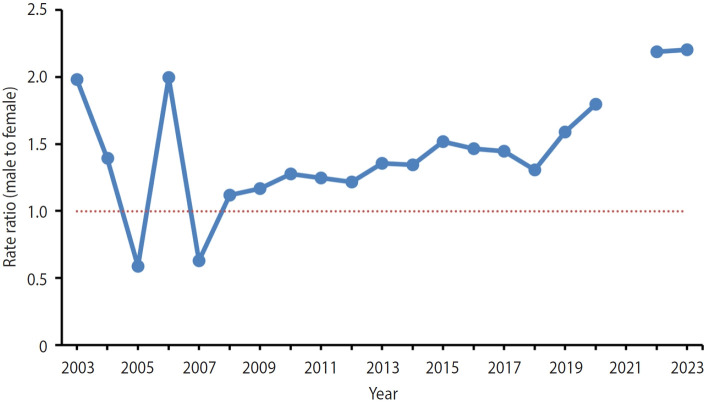
Methods: We aggregated severe complicated influenza cases by month, area (city/county), age, and sex. The age-standardized incidence rate (ASIR) was calculated to compare differences across regions and populations. Yearly incidence rate ratios comparing males to females were also computed to assess sex differences.
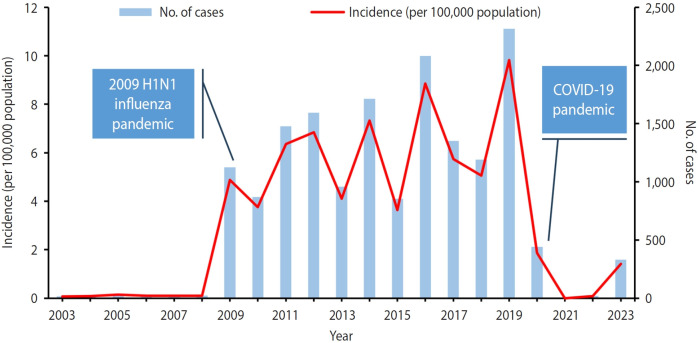
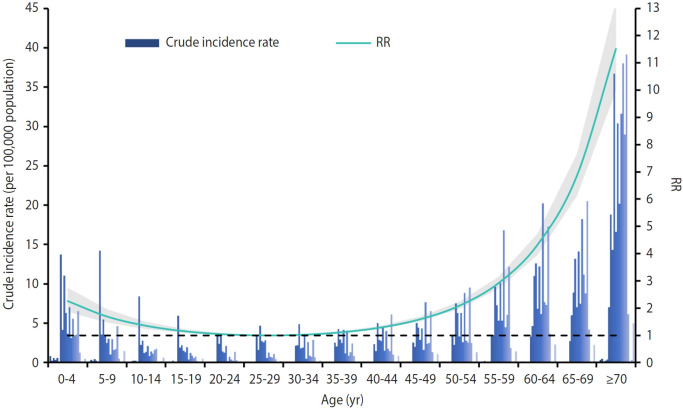
Results: A total of 16,459 cases were included from 2003 to 2023. Crude incidence rates per 100,000 population were 0.07-0.14 for 2003-2008, 3.64-9.81 for 2009-2019, and 0.00-1.87 for 2020-2023. Higher incidence rates were observed in Hualien and Taitung Counties, with average ASIRs exceeding 10.00 per 100,000 population, compared to other cities. Except for 2005 and 2007, the incidence among males exceeded that among females, with ASIR ratios ranging from 1.10 to 2.20. The highest incidence was observed among populations aged 0-4 and those aged ≥55.
Conclusions: The incidence of severe complicated influenza exhibited clear regional and demographic variations in Taiwan region. The observed rebound in incidence calls for increased vigilance to protect vulnerable populations from severe illness.
Keywords: Epidemiology; Incidence; Severe influenza.
Conflict of interest statement
The authors have no conflicts of interest to declare for this study.
Figures
Similar articles
-
Surveillance for Violent Deaths - National Violent Death Reporting System, 50 States, the District of Columbia, and Puerto Rico, 2022.MMWR Surveill Summ. 2025 Jun 12;74(5):1-42. doi: 10.15585/mmwr.ss7405a1. MMWR Surveill Summ. 2025. PMID: 40493548 Free PMC article.
-
Trends and levels of the global, regional, and national burden of appendicitis between 1990 and 2021: findings from the Global Burden of Disease Study 2021.Lancet Gastroenterol Hepatol. 2024 Sep;9(9):825-858. doi: 10.1016/S2468-1253(24)00157-2. Epub 2024 Jul 17. Lancet Gastroenterol Hepatol. 2024. PMID: 39032499 Free PMC article.
-
Influence of the Enterovirus 71 Vaccine and the COVID-19 Pandemic on Hand, Foot, and Mouth Disease in China Based on Counterfactual Models: Observational Study.JMIR Public Health Surveill. 2024 Dec 17;10:e63146. doi: 10.2196/63146. JMIR Public Health Surveill. 2024. PMID: 39692430 Free PMC article.
-
Prenatal administration of progestogens for preventing spontaneous preterm birth in women with a multiple pregnancy.Cochrane Database Syst Rev. 2019 Nov 20;2019(11):CD012024. doi: 10.1002/14651858.CD012024.pub3. Cochrane Database Syst Rev. 2019. PMID: 31745984 Free PMC article.
-
Prevalence of osteoporosis and associated factors among Chinese adults: a systematic review and modelling study.J Glob Health. 2025 Jan 17;15:04009. doi: 10.7189/jogh.15.04009. J Glob Health. 2025. PMID: 39820179 Free PMC article.
References
-
- World Health Organization. Influenza (seasonal); 2023 [cited 2024 Nov 23]. Available from: https://www.who.int/news-room/fact-sheets/detail/influenza-(seasonal)
-
- Taiwan Centers for Disease Control. Influenza case with severe complications; 2022 [cited 2024 Nov 23]. Available from: https://www.cdc.gov.tw/Uploads/d3ea8431-66f7-4e62-8519-bff9d61737cb.pdf (Chinese)
MeSH terms
LinkOut - more resources
Full Text Sources
Medical