

Design of a GFP reporter for splicing analysis in mammalian cells
- PMID: 40212027
- PMCID: PMC11982954
- DOI: 10.1016/j.btre.2025.e00887
Design of a GFP reporter for splicing analysis in mammalian cells
Abstract
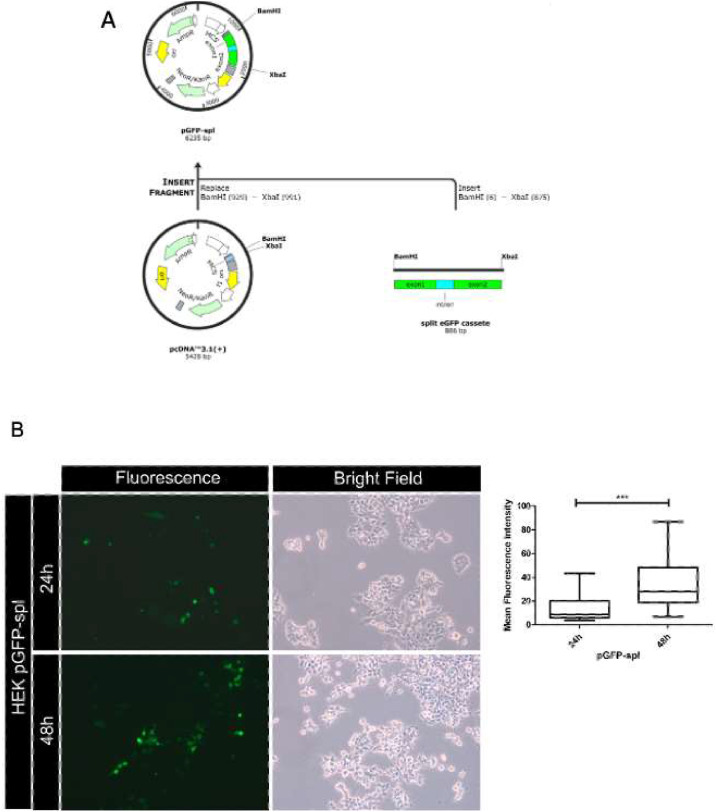
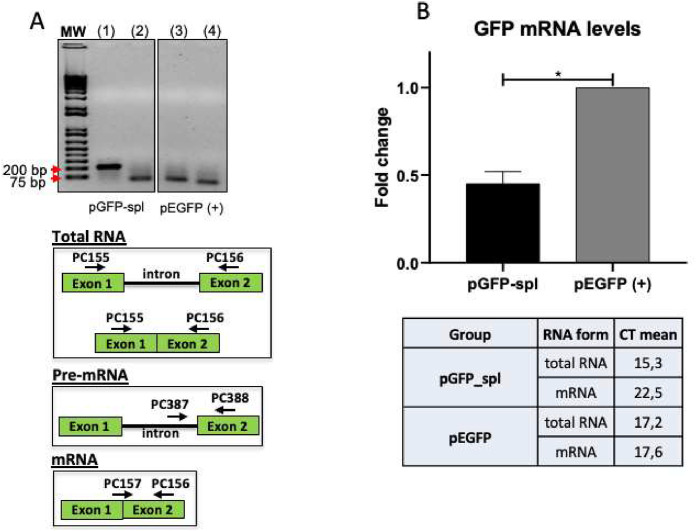
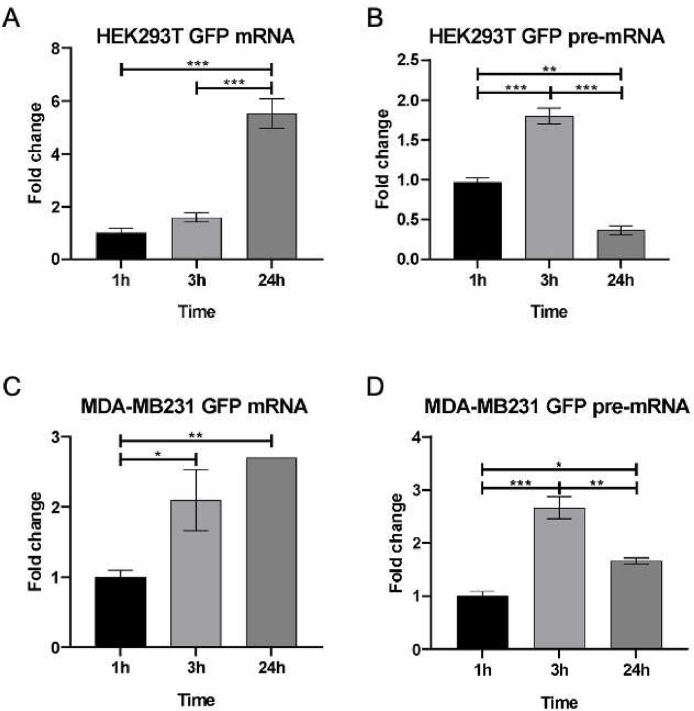
Eukaryotic genes are formed by exons and introns. Pre-mRNA splicing promotes exon ligation and intron removal and is performed by a specialized macromolecular machinery named spliceosome, composed of five small ribonucleoprotein particles (snRNPs) and more than one hundred proteins. The activity of this complex is highly accurate due to the coordinated activity of its components. Altered splicing has been related to the development of several diseases, including neurodegenerative disorders, such as amyotrophic lateral sclerosis, and different types of cancer. Detailed understanding of splicing regulation in eukaryotic cells can be achieved using splicing reporter systems. We designed a reporter plasmid suitable for splicing analysis in cultured mammalian cells. Our reporter is based on GFP expression, and the splicing outcome can be easily visualized by fluorescence microscopy. We quantified splicing activity in two human cell lines, HEK-293T and MDA-MB-231, confirming its suitability for use in live cells in culture.
Keywords: GFP; Pre-mRNA splicing; Reporter system.
© 2025 The Author(s).
Conflict of interest statement
The authors declare the following financial interests/personal relationships which may be considered as potential competing interests: Patricia Pereira Coltri reports financial support was provided by State of Sao Paulo Research Foundation. Patricia Pereira Coltri reports financial support was provided by National Council for Scientific and Technological Development. If there are other authors, they declare that they have no known competing financial interests or personal relationships that could have appeared to influence the work reported in this paper.
Figures
Similar articles
-
Using yeast genetics to study splicing mechanisms.Methods Mol Biol. 2014;1126:285-98. doi: 10.1007/978-1-62703-980-2_21. Methods Mol Biol. 2014. PMID: 24549672 Free PMC article.
-
A Genetic Screen Identifies PRP18a, a Putative Second Step Splicing Factor Important for Alternative Splicing and a Normal Phenotype in Arabidopsis thaliana.G3 (Bethesda). 2018 Mar 28;8(4):1367-1377. doi: 10.1534/g3.118.200022. G3 (Bethesda). 2018. PMID: 29487188 Free PMC article.
-
Mechanisms and Regulation of Alternative Pre-mRNA Splicing.Annu Rev Biochem. 2015;84:291-323. doi: 10.1146/annurev-biochem-060614-034316. Epub 2015 Mar 12. Annu Rev Biochem. 2015. PMID: 25784052 Free PMC article. Review.
-
5'-UTR mediated translational control of splicing assembly factor RNP-4F expression during development of the Drosophila central nervous system.Gene. 2013 Oct 10;528(2):154-62. doi: 10.1016/j.gene.2013.07.027. Epub 2013 Jul 25. Gene. 2013. PMID: 23892091
-
Mechanisms and regulation of spliceosome-mediated pre-mRNA splicing in Saccharomyces cerevisiae.Wiley Interdiscip Rev RNA. 2024 Jul-Aug;15(4):e1866. doi: 10.1002/wrna.1866. Wiley Interdiscip Rev RNA. 2024. PMID: 38972853 Free PMC article. Review.
References
-
- Wilkinson M.E., Charenton C., Nagai K. RNA splicing by the spliceosome. Annu. Rev. Biochem. 2020;89:359–388. - PubMed
-
- Staley J.P., Guthrie C. Mechanical devices of the spliceosome: motors, clocks, springs, and things. Cell. 1998;92(3):315–326. - PubMed
-
- Coltri P.P., Dos Santos M.G.P., da Silva G.H.G. Splicing and cancer: challenges and opportunities. Wiley. Interdiscip. Rev. RNA. 2019;10(3):e1527. - PubMed
LinkOut - more resources
Full Text Sources
Miscellaneous