. 2024 Jul 9;4(10):2400123.
doi: 10.1002/smsc.202400123. eCollection 2024 Oct.

Fractal Characterization of Simulated Metal Nanocatalysts in 3D

Affiliations

Fractal Characterization of Simulated Metal Nanocatalysts in 3D

Jonathan Y C Ting et al. Small Sci. .

Abstract

The surface roughness of metal nanoparticles is known to be influential toward their properties, but the quantification of surface roughness is challenging. Given the recent availability of large-scale simulated data and tools for the computation of the box-counting dimension of simulated atomistic objects, researchers are now enabled to study the connections between the surface roughness of metal nanoparticles and their properties. Herein, the relationships between the fractal box-counting dimension of metal nanoparticle surfaces and structural features relevant to experimental and computational studies are investigated, providing actionable insights for the manufacturing of rough nanoparticles. This approach differs from conventional concepts of roughness, but introduces a possible indicator for their functionalities such as catalytic performance that was not previously accessible. It is found that, while it remains difficult to consistently correlate the dimension with the catalytic activity of surface facets, matching trends with their surface energy, thermodynamic stability, and number of bond vacancy are observed. This highlights the potential of fractal box-counting dimensions to rationalize catalytic activity trends among metal nanoparticles, and opens up opportunities for the design of nanocatalysts with better performance via surface engineering.

Keywords: fractal dimension; metal nanoparticles; structural features; surface roughness.


Conflict of interest statement

The authors declare no conflict of interest.

Figures

Figure 1
Figure 1
Results from applying the box‐counting algorithm on a Pd nanoparticle, turning a) a mathematically exact representation of its surface into b) box‐counts at different scales, and c) fitting a linear regression to the results.
Figure 2
Figure 2
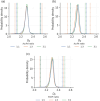
Probability density distributions of box‐counting dimensions for a) all, b) monometallic, c) bimetallic, and d) trimetallic nanoparticles, where the areas under the curves sum up to 1. The vertical lines indicate the top and bottom 10% threshold for defining smooth and rough nanoparticles.
Figure 3
Figure 3
Surface structures (upper) and radial distribution functions (lower) of cubic Au (left), Pd (middle), and Pt (right) nanoparticles. The gaps between atoms decrease following the trend of Au > Pd > Pt.
Figure 4
Figure 4
Probability density distribution of box‐counting dimensions for a) AuPd, b) AuPt, and c) PdPt with different alloying ratios, where the areas under the curves sum up to 1. The vertical lines indicate the top and bottom 10% threshold for defining smooth and rough nanoparticles.
Figure 5
Figure 5
Probability density distribution of box‐counting dimensions for a) AuPd, b) AuPt, and c) PdPt nanoparticles with different degrees of surface segregation, where the areas under the curves sum up to 1. The vertical lines indicate the top and bottom 10% threshold for defining smooth and rough nanoparticles.
Figure 6
Figure 6
Probability density distribution of box‐counting dimensions for AuPdPt nanoparticles with different degrees of a) Au, b) Pd, and c) Pt surface segregation, where the areas under the curves sum up to 1. The vertical lines indicate the top and bottom 10% threshold for defining smooth and rough nanoparticles. There is only one nanoparticle that satisfies the 1:1:1 elemental ratio on the surface.
Figure 7
Figure 7
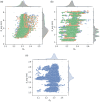
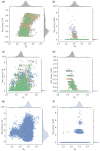
Scatter plot of box‐counting dimension and temperature for a) monometallic (with Au shown in blue, Pd in orange and Pt in green), b) bimetallic (with AuPd shown in blue, AuPt in orange and PdPt in green), and c) trimetallic (blue) nanoparticles. The mutual information scores for the relationships are provided in Table 1, with higher values indicating greater dependencies of the feature on box‐counting dimension.
Figure 8
Figure 8
Scatter plot of box‐counting dimension and average diameter for a) monometallic (with Au shown in blue, Pd in orange and Pt in green), b) bimetallic (with AuPd shown in blue, AuPt in orange and PdPt in green), and c) trimetallic (blue) nanoparticles. The mutual information scores for the relationships are provided in Table 1, with higher values indicating greater dependencies of the feature on box‐counting dimension.
Figure 9
Figure 9
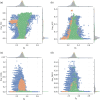
Scatter plot of box‐counting dimension and fraction of atoms with specific crystal structures, including a) face‐centered cubic, b) hexagonal close‐packed, c) icosahedral, and d) decahedral packing. The green, blue, and orange points correspond to monometallic, bimetallic, and trimetallic nanoparticles, respectively. The mutual information scores for the relationships are provided in Table 1, with higher values indicating greater dependencies of the feature on box‐counting dimension.
Figure 10
Figure 10
Probability density distribution of the average diameter for rough and smooth nanoparticles as defined by a box‐counting dimension threshold of 2.45, where the areas under the curves sum up to 1.
Figure 11
Figure 11
Scatter plot of box‐counting dimension and average number of bonded atoms for a) monometallic (with Au shown in blue, Pd in orange, and Pt in green), b) bimetallic (with AuPd shown in blue, AuPt in orange, and PdPt in green), and c) trimetallic (blue) nanoparticles. The mutual information scores for the relationships are provided in Table 1, with higher values indicating greater dependencies of the feature on box‐counting dimension.
Figure 12
Figure 12
Box‐counting dimensions of the outlier nanoparticle rotated along the x and y axes.
Figure 13
Figure 13
The orientation of the outlier palladium nanoparticle with respect to the simulation box. The outlier among the Pd nanoparticles with a lower D B than other MNPs is found to be an ordered rhombic dodecahedron. While other ordered rhombic dodecahedra exists in the dataset, this configuration stands out as one that is particularly well aligned to the axes defining the simulation box.
Figure 14
Figure 14
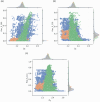
Scatter plot of box‐counting dimension and fraction of surface atoms lying on a) {100}, b) {110}, and c) {111} facets. The green, blue, and orange points correspond to monometallic, bimetallic, and trimetallic nanoparticles, respectively. The mutual information scores for the relationships are provided in Table 1, with higher values indicating greater dependencies of the feature on box‐counting dimension.
Figure 15
Figure 15
Scatter plot of box‐counting dimension and number of atoms lying on surface with a,c,e) 1–10° and b,d,f) 71–80° curvatures for monometallic (a,b: Au, blue; Pd, orange; Pt, green), bimetallic (c,d: AuPd, blue; AuPt, orange; PdPt, green), and trimetallic (e,f: blue) nanoparticles. The mutual information scores for the relationships are provided in Table 1, with higher values indicating greater dependencies of the feature on box‐counting dimension. Additional results are provided in the Supporting Information for comparison.
Figure 16
Figure 16
Probability density distributions of bond length standard deviations for a) AuPd, b) AuPt, and c) PdPt nanoparticles with different degrees of surface segregation, where the areas under the curves sum up to 1.
Figure 17
Figure 17
The bond angle distributions of Pd nanoparticles with higher and lower fractions of atoms in face‐centered cubic packings, denoted as ordered and disordered, respectively.
Figure 18
Figure 18
The a) different types of atoms and b) terrace atoms on nanoparticle surface as nanoparticle diameter increases.
Figure 19
Figure 19
Box‐counting dimensions of nanoparticles with different surface facets.

References

    1. Rodrigues T. S., da Silva A. G. M., Camargo P. H. C., J. Mater. Chem. A 2019, 7, 5857.
    1. Narayan N., Meiyazhagan A., Vajtai R., Materials 2019, 12, 3602. - PMC - PubMed
    1. Cui C.‐H., Yu S.‐H., Acc. Chem. Res. 2013, 46, 1427. - PubMed
    1. Jeon T. Y., Yu S. H., Yoo S. J., Park H. Y., Kim S. K., Carbon Energy 2021, 3, 375.
    1. Cui C.‐H., Li H.‐H., Liu X.‐J., Gao M.‐R., Yu S.‐H., ACS Catal. 2012, 2, 916.

LinkOut - more resources