The gut microbiota in mice with erythropoietin-induced abdominal aortic aneurysm
- PMID: 40212374
- PMCID: PMC11984472
- DOI: 10.7717/peerj.19222
The gut microbiota in mice with erythropoietin-induced abdominal aortic aneurysm
Abstract
Background: In recent years, a novel animal abdominal aortic aneurysm (AAA) model was established by administering erythropoietin (EPO) to wild-type (WT) mice. However, the influence of EPO on the murine fecal microbiota remains uninvestigated. Therefore, this study aims to explore the potential association between gut microbiota changes and AAA development in this model.
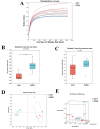
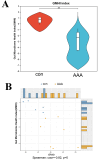
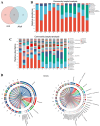
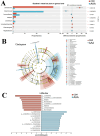
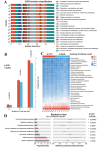
Methods and results: Adult male C57BL/6 mice were used to establish the AAA model by intraperitoneal administration of recombinant human EPO at a dosage of 10,000 IU/kg daily for 28 consecutive days. Hematoxylin and eosin (H&E) and Elastin Van Gieson (EVG) staining revealed that EPO administration increased aortic wall thickness and diameter, accompanied by enhanced degradation of the elastic lamina. The 16S rRNA-sequencing data were deposited in the Sequence Read Archive (PRJNA1172300). LEfSe analysis revealed that Akkermansia, Lawsonibacter, Clostridium, and Neglectibacter were significantly associated with EPO-induced AAA development, while Lactobacillus, Alistipes, Limosilactobacillus, and Eisenbergiella showed significant negative correlations. Analysis using the Kyoto Encyclopedia of Genes and Genomes (KEGG) prediction module revealed significant differences in metabolic pathways between the two groups, including alanine, aspartate and glutamate metabolism; cysteine and methionine metabolism; pyrimidine metabolism; carbon metabolism; ABC transporters; and oxidative phosphorylation pathways.
Conclusions: EPO-induced gut dysbiosis, particularly changes in Akkermansia, Lactobacillus, and Alistipes abundance, may contribute to AAA formation via inflammation, oxidative stress, and metabolic dysfunction. While this model advances AAA research, its limitations underscore the need for human validation and mechanistic studies. Future work should prioritize multi-omics integration and cross-model comparisons to unravel the complex microbiota-AAA axis.
Keywords: 16S rRNA-sequencing; Abdominal aortic aneurysm; Erythropoietin; Gut microbiota.
©2025 Lyu et al.
Conflict of interest statement
The authors declare there are no competing interests.
Figures

References
-
- Bolyen E, Rideout JR, Dillon MR, Bokulich NA, Abnet CC, Al-Ghalith GA, Alexander H, Alm EJ, Arumugam M, Asnicar F, Bai Y, Bisanz JE, Bittinger K, Brejnrod A, Brislawn CJ, Brown CT, Callahan BJ, Caraballo-Rodríguez AM, Chase J, Cope EK, Da Silva R, Diener C, Dorrestein PC, Douglas GM, Durall DM, Duvallet C, Edwardson CF, Ernst M, Estaki M, Fouquier J, Gauglitz JM, Gibbons SM, Gibson DL, Gonzalez A, Gorlick K, Guo J, Hillmann B, Holmes S, Holste H, Huttenhower C, Huttley GA, Janssen S, Jarmusch AK, Jiang L, Kaehler BD, Kang KB, Keefe CR, Keim P, Kelley ST, Knights D, Koester I, Kosciolek T, Kreps J, Langille MGI, Lee J, Ley R, Liu YX, Loftfield E, Lozupone C, Maher M, Marotz C, Martin BD, McDonald D, McIver LJ, Melnik AV, Metcalf JL, Morgan SC, Morton JT, Naimey AT, Navas-Molina JA, Nothias LF, Orchanian SB, Pearson T, Peoples SL, Petras D, Preuss ML, Pruesse E, Rasmussen LB, Rivers A, Robeson 2nd MS, Rosenthal P, Segata N, Shaffer M, Shiffer A, Sinha R, Song SJ, Spear JR, Swafford AD, Thompson LR, Torres PJ, Trinh P, Tripathi A, Turnbaugh PJ, Ul-Hasan S, vander Hooft JJJ, Vargas F, Vázquez-Baeza Y, Vogtmann E, von Hippel M, Walters W, Wan Y, Wang M, Warren J, Weber KC, Williamson CHD, Willis AD, Xu ZZ, Zaneveld JR, Zhang Y, Zhu Q, Knight R, Caporaso JG. Reproducible, interactive, scalable and extensible microbiome data science using QIIME 2. Nature Biotechnology. 2019;37:852–857. doi: 10.1038/s41587-019-0209-9. - DOI - PMC - PubMed
MeSH terms
Substances
LinkOut - more resources
Full Text Sources
Research Materials

