. 2020 Oct 21;1(1):2000015.
doi: 10.1002/smsc.202000015. eCollection 2021 Jan.

Interface Engineering in Organic Electronics: Energy-Level Alignment and Charge Transport

Affiliations

Interface Engineering in Organic Electronics: Energy-Level Alignment and Charge Transport

Peicheng Li et al. Small Sci. .

Abstract

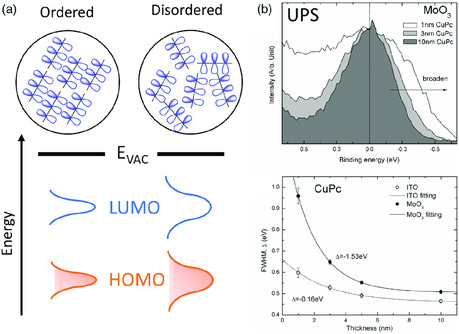
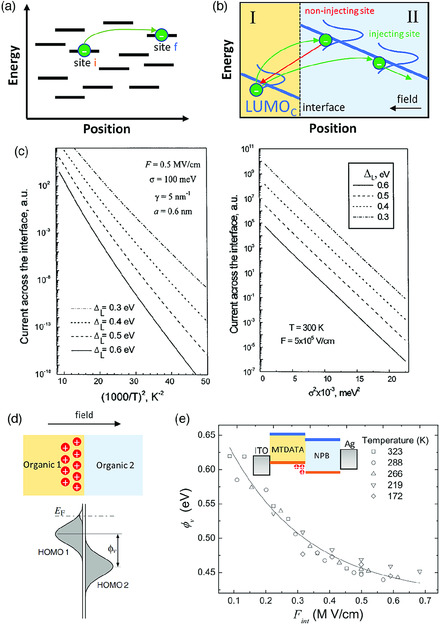
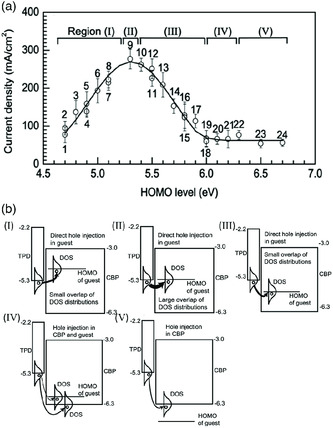
Organic light-emitting diodes (OLEDs) and organic solar cells are new members of trillion-dollar semiconductor industry. The structure of these devices generally consists of a stack of several organic layers sandwiched between two electrodes. The electronic processes such as the energy-level alignment at and charge transport across these interfaces play a key role to the overall performance of the organic devices. Thus, interface physics is important for design and engineering of organic devices. Herein, recent progress in energy-level alignment at and charge transport across organic interfaces is reviewed. In addition, basic material physics of organic semiconductors such as energy levels, energy disorder, and molecular orientation is introduced. Recent progress in theories and experiments on energy-level alignment at and charge transport across molecular heterojunctions is then discussed. Case studies of applying interface physics for guiding fabrication of ideal devices are also provided.

Keywords: charge transport; electronic properties; energy-level alignment; organic interfaces; organic optoelectronics.


Conflict of interest statement

The authors declare no conflict of interest.

Figures

Figure 1
Figure 1
a) Molecular structure of a free‐standing π‐conjugated CuPc; b) schematic various energy levels of an organic molecule; c) thin film in which molecules take crystalline or amorphous packing; d) schematic various energy levels in a solid film where LUMO and HOMO are broadened.
Figure 2
Figure 2
Energy disorder of organic semiconductor: a) impact of molecular packing on the energy disorder; b) experimental observed interface disorder. The top right figure is the CuPc HOMO spectra taken at various thicknesses and the bottom right figure is the HOMO width as a function of the film thickness. Reproduced with permission.[ 56 ] Copyright 2019, Springer Nature.
Figure 3
Figure 3
Molecular orientations in organic semiconductor. A free molecule and organic film with the face‐on or edge‐on orientation are shown. For a free molecule, the E VAC refers to the electron energy at infinity distance. And for organic film, the E VAC refers to the energy of a static electron just outside the film surface.
Figure 4
Figure 4
Orientation‐dependent core‐level IE: a) definition of the core‐level IE; b) experimental data comparing core‐level and HOMO IE shift due to the variance of molecular orientation. Reproduced with permission.[ 83 ] Copyright 2018, the American Institute of Physics.
Figure 5
Figure 5
Schematic device structure of OLED and OPV, and their corresponding energy‐level diagrams.
Figure 6
Figure 6
Energy‐level alignment at electrode–organic interface: a) energy‐level diagram at electrode–organic interface; b) electrochemical equilibrium model where the formation of charged molecules at the interface determines the energy‐level alignment; c) full experimental demonstration of the UELA of organic semiconductor (C60) on various metal oxide electrodes. Reproduced with permission.[ 13 ] Copyright 2011, Springer Nature. Reproduced with permission.[ 105 ] Copyright 2014, The American Physical Society.
Figure 7
Figure 7
Energy‐level alignment at organic–organic interface: a) Energy‐level diagram at organic–organic interface; b) UELA at organic–organic interface. Reproduced with permission.[ 19 ] Copyright 2017, Wiley‐VCH.
Figure 8
Figure 8
Charge injection at electrode–organic interface: a) Schematic of charge injection process at electrode–organic interface; b) calculated J–V characteristics of the NPB hole‐only device with various injection barrier, where the barrier of 0.25 or 0.55 eV leads to SCLC or ILC regime, and the barrier of 0.40 eV leads to quasi‐Ohmic regime; c) Schematic of a hole‐only device and the electrical field at the interface; d) field at the interface as a function of the injection barrier. Reproduced with permission.[ 126 ] Copyright 2009, The American Physical Society.
Figure 9
Figure 9
Charge injection at organic‐organic interface: a) schematic of the electron hopping between organic molecules; b) schematic of the electron injection from organic layer I into organic layer II; c) calculated injection current with various injection barrier as a function of temperature or energy disorder of the organic layer II; d) Fermi‐level realignment due to charge carriers present at organic–organic interface; e) calculated injection barrier as a function of the field at the interface. Reproduced with permission.[ 137 ] Copyright 2001, American Institute of Physics. Reproduced with permission.[ 139 ] Copyright 2008, The American Physical Society.
Figure 10
Figure 10
Charge transport in lightly doped host–guest semiconductor: a) schematic of hole trapping and detrapping process in host–guest semiconductor; b) experimentally measured hole mobility of host:guest organic semiconductor (CBP:2 wt% Ir(ppy)2(acac)) as a function of the electrical field under various temperature; c) zero‐field hole mobility as a function of the temperature; d) UPS spectra of host/guest interface (CBP/Ir(ppy)2(acac)). Reproduced with permission.[ 151 ] Copyright 2020, Wiley‐VCH.
Figure 11
Figure 11
Charge transport in heavily doped host–guest semiconductor: a) schematic of hole percolation transport through guest sites; b) experimentally measured hole mobility of host:guest organic semiconductor (CBP:30 wt% Ir(ppy)2(acac)) as a function of the electrical field under various temperature; c) the hole mobility of host:guest organic semiconductor (CBP:Ir(ppy)2(acac)) at the field of 5 × 107 V m−1 as a function of the guest concentration. Reproduced with permission.[ 151 ] Copyright 2020, Wiley‐VCH.
Figure 12
Figure 12
Misinterpretation of the charge mobility by using SCLC method on the device without Ohmic contact: a) experimentally measured J–V characteristics of NPB hole‐only devices fabricated on various electrodes; b) deduced hole mobility by using SCLC model as a function of the electrical field, showing a significant deviation from the mobility determined by ToF method; c) UPS valence band spectra of NPB deposited on various electrodes showing large injection barriers. Reproduced with permission.[ 154 ] Copyright 2010, American Institute of Physics.
Figure 13
Figure 13
Engineering ideal electrode–organic interface for OLEDs: a) UPS spectra of CBP deposited on chlorinated ITO electrode showing a reduction of the injection barrier due to the increasing work function of ITO; b) J–V characteristic of OLEDs fabricated on chlorinated ITO showing the reduced operating voltage due to enhanced injection at the electrode–organic interface; c) EQE of OLED fabricated on chlorinated ITO; d) UPS spectra of CBP deposited on the bare ITO and the ITO coated with WO3; e) J–V and luminance–V characteristics of OLEDs fabricated on the ITO with and without the WO3; f) current efficiency and power efficiency as a function of the luminance for OLEDs made on the oxide‐coated ITOs. Reproduced with permission.[ 160 ] Copyright 2011, American Association for the Advancement of Science. Reproduced with permission.[ 165 ] Copyright 2010, American Institute of Physics.
Figure 14
Figure 14
Charge injection at HTL/EL interface in OLED: a) current density (under 10 V bias) of OLEDs doped with various guest molecules as a function of the guest HOMO levels; b) schematic of charge injection process at the HTL/EL interfaces. Reproduced with permission.[ 173 ] Copyright 2007, Elsevier.

Similar articles

References

    1. Liu S., Yuan J., Deng W., Luo M., Xie Y., Liang Q., Zou Y., He Z., Wu H., Cao Y., Nat. Photonics 2020, 14, 300.
    1. Zhu L., Zhang M., Zhou G., Hao T., Xu J., Wang J., Qiu C., Prine N., Ali J., Feng W., Gu X., Ma Z., Tang Z., Zhu H., Ying L., Zhang Y., Liu F., Adv. Energy Mater. 2020, 10, 1904234.
    1. Zhou Z., Liu W., Zhou G., Zhang M., Qian D., Zhang J., Chen S., Xu S., Yang C., Gao F., Zhu H., Liu F., Zhu X., Adv. Mater. 2020, 32, 1906324. - PubMed
    1. Xu X., Yao Y., Shan B., Gu X., Liu D., Liu J., Xu J., Zhao N., Hu W., Miao Q., Adv. Mater. 2016, 28, 5276. - PubMed
    1. Wang C., Zhang X., Dong H., Chen X., Hu W., Adv. Energy Mater. 2020, 10, 2000955.

LinkOut - more resources