. 2025 Mar 27:17:1498478.
doi: 10.3389/fnagi.2025.1498478. eCollection 2025.

Interaction and overall effects of underweight, low muscle mass, malnutrition, and inflammation on early-onset mild cognitive impairment in type 2 diabetes

Affiliations

Interaction and overall effects of underweight, low muscle mass, malnutrition, and inflammation on early-onset mild cognitive impairment in type 2 diabetes

Chen-Ying Lin et al. Front Aging Neurosci. .

Abstract

Introduction: This study systematically explores the overall impact and interactions of body composition and nutritional inflammatory indices on early-onset mild cognitive impairment (EOMCI) in type 2 diabetes mellitus (T2DM).

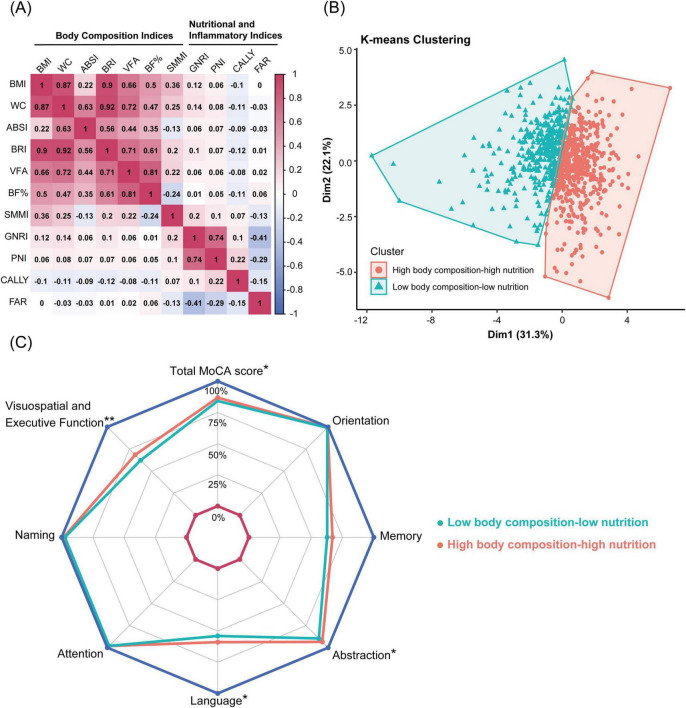
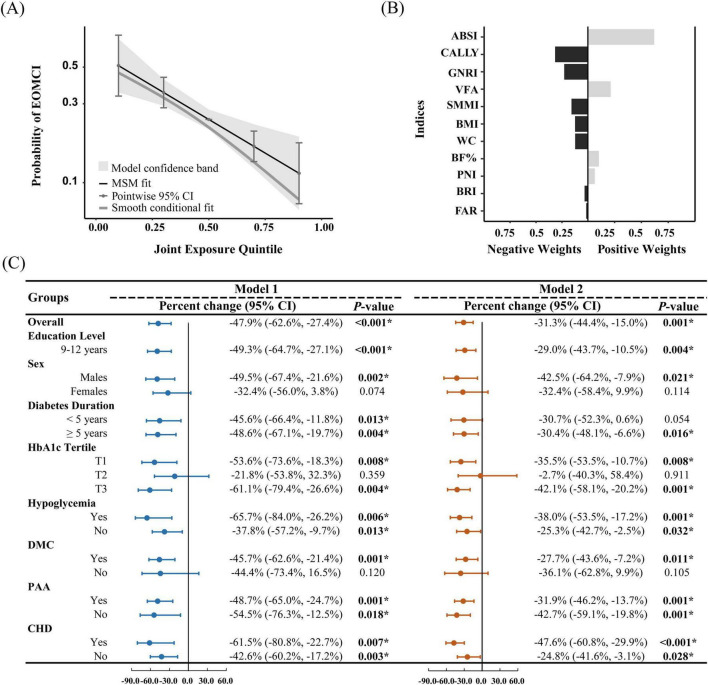
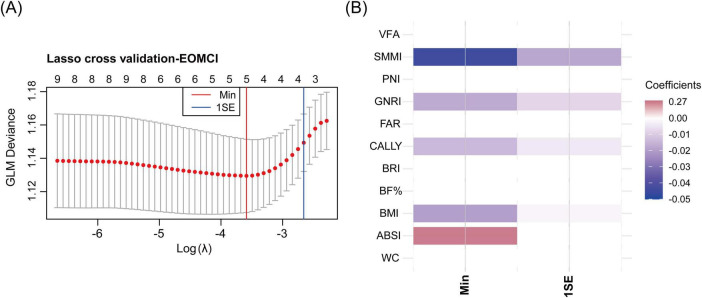
Methods: A cross-sectional study included 816 T2DM patients. Body composition indices included body mass index (BMI), waist circumference (WC), a body shape index (ABSI), body roundness index (BRI), visceral fat area (VFA), body fat percentage (BF%), and skeletal muscle mass index (SMMI). Nutritional inflammatory indices included the geriatric nutritional risk index (GNRI), prognostic nutritional index (PNI), C-reactive protein-albumin-lymphocyte index (CALLY), and fibrinogen-to-albumin ratio (FAR). K-means clustering and quantile g-computation (QGC) assessed the combined impact, with interactions evaluated by simple slope analysis.

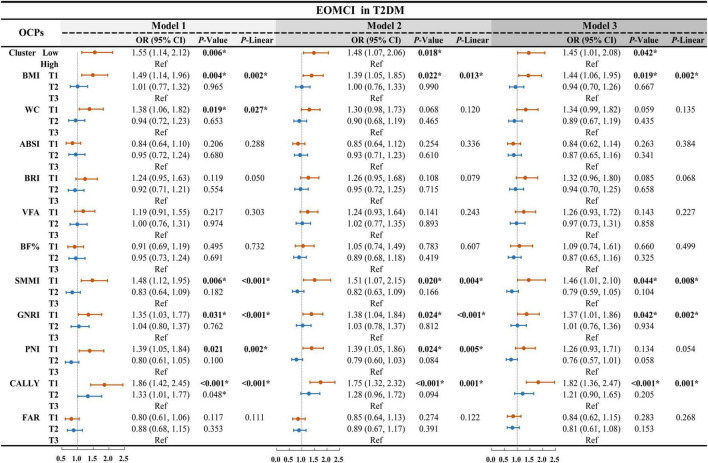
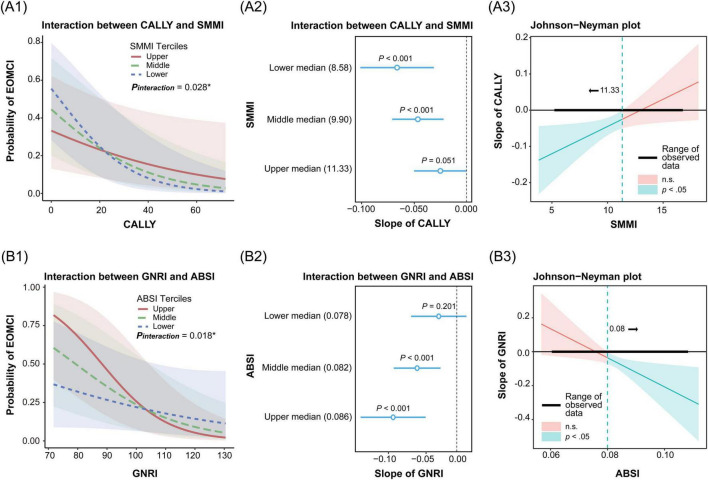
Results: K-means clustering revealed two distinct patterns: Low-pattern and High-pattern. The Low-pattern group exhibited significantly lower body composition indices (BMI 24.6 vs. 27.7 kg/m2; WC 88 vs. 99 cm; ABSI 0.081 vs. 0.084; BRI 3.89 vs. 5.02; VFA 91 vs. 112; BF% 29% vs. 31%; SMMI 9.38 vs. 10.48 kg/m2; all P < 0.001) and poorer nutritional status with higher inflammation (GNRI 97.9 vs. 104.6; PNI 47.9 vs. 53.1; CALLY index 4 vs. 5; FAR 0.082 vs. 0.072; all P < 0.05). This group had a higher prevalence of EOMCI (32% vs. 23%, P = 0.006). After adjusting for confounders, the Low-pattern group had a 1.45-fold increased risk of EOMCI (OR 1.45, 95% CI 1.01-2.08). QGC analysis demonstrated that the combined overall effect of body composition and nutritional inflammatory indices was negatively associated with EOMCI risk. A one-quintile increase in all indices was linked to a significant 31.3% reduction in EOMCI risk (95% CI -44.4%, -15.0%). Interaction analysis revealed that abdominal obesity (ABSI > 0.08), combined with malnutrition (low GNRI), significantly increased EOMCI risk (P interaction = 0.018). Similarly, low muscle mass (SMMI < 11.33 kg/m2), when combined with malnutrition and high inflammation (low CALLY index), further exacerbated EOMCI risk (P interaction = 0.028).

Discussion: The findings suggest that in T2DM patients, the interactions and overall effects of underweight, reduced muscle mass, abdominal obesity, malnutrition, and elevated inflammation are significantly associated with an increased risk of EOMCI. Integrated management of these factors is essential to mitigate EOMCI risk.

Keywords: inflammation; interaction; malnutrition; mild cognitive impairment; sarcopenia; type 2 diabetes mellitus.


Conflict of interest statement

The authors declare that the research was conducted in the absence of any commercial or financial relationships that could be construed as a potential conflict of interest.

Figures

FIGURE 1
FIGURE 1
Multivariable-adjusted logistic regression for body composition, nutritional inflammatory indices, and cluster patterns on EOMCI in T2DM. EOMCI, early-onset mild cognitive impairment; T2DM, type 2 diabetes mellitus; BMI, body mass index; WC, waist circumference; ABSI, A body shape index; BRI, body roundness index; VFA, visceral fat area; BF%, body fat percentage; SMMI, skeletal muscle mass index; GNRI, geriatric nutritional risk index; PNI, prognostic nutritional index; CALLY, C-reactive protein-albumin-lymphocyte index; FAR, fibrinogen to albumin ratio; OR, odds ratio; CI, confidence interval; Ref, reference. This forest plot presents multivariable-adjusted logistic regression analyses examining the associations between individual body composition indices, nutritional inflammatory indices, and their cluster patterns with the risk of EOMCI in participants with T2DM. The analyses include three models: Model 1 (unadjusted), Model 2 (adjusted for age, sex, marital status, and duration of education), and Model 3 (further adjusted for diabetes duration, HbA1c, FPG, hypoglycemia frequency, smoking status, regular exercise, diabetes dietary control, UACR, AST, and Hb). *P < 0.05; P-Linear, the P-value for the linear trend test.
FIGURE 2
FIGURE 2
Correlation analysis and K-means clustering of body composition and nutritional inflammatory indices. (A) Heatmap showing the Pearson correlation matrix of body composition and nutritional inflammatory indices. (B) K-means clustering of 816 participants based on body composition and nutritional inflammatory indices, identifying two clusters: high body composition-high nutrition pattern and low body composition-low nutrition pattern. (C) Radar chart comparing total MoCA scores and subdomain scores between the high body composition-high nutrition pattern and the low body composition-low nutrition pattern. Significant differences are marked: **P < 0.001, *P < 0.05. BMI, body mass index; WC, waist circumference; ABSI, A body shape index; BRI, body roundness index; VFA, visceral fat area; BF%, body fat percentage; SMMI, skeletal muscle mass index; GNRI, geriatric nutritional risk index; PNI, prognostic nutritional index; CALLY index, C-reactive protein-albumin-lymphocyte index; FAR, fibrinogen to albumin ratio.
FIGURE 3
FIGURE 3
Quantile g-computation for assessing the overall effect of body composition and nutritional inflammatory indices, and the positive and negative contributions of indices. (A) Probability of EOMCI by joint exposure quintile, with the third quintile as the reference. (B) Positive and negative weights of body composition and nutritional inflammatory indices on EOMCI risk, based on the fully adjusted Model 2. (C) Overall analysis and stratified analysis by sex, education level, diabetes duration, HbA1c tertiles, hypoglycemia, DMC, PAA, and CHD. The figure shows the percentage change and 95% confidence intervals (CIs) for the overall effect of body composition and nutritional inflammatory indices on EOMCI risk. Model 1 (unadjusted) and Model 2 (adjusted for age, sex, marital status, education level, diabetes duration, HbA1c, FPG, hypoglycemia frequency, smoking status, regular exercise, diabetes dietary control, UACR, AST, and Hb, with respective adjustments for each subgroup, excluding the stratifying variable). Significant differences are marked: *P < 0.05. BMI, body mass index; WC, waist circumference; ABSI, A body shape index; BRI, body roundness index; VFA, visceral fat area; BF%, body fat percentage; SMMI, skeletal muscle mass index; GNRI, geriatric nutritional risk index; PNI, prognostic nutritional index; CALLY, C-reactive protein-albumin-lymphocyte index; FAR, fibrinogen to albumin ratio; DMC, diabetic microvascular complications; PAA, peripheral arterial atherosclerosis; CHD, coronary heart disease.
FIGURE 4
FIGURE 4
LASSO cross-validation for identifying key body composition and nutritional inflammatory indices associated with EOMCI. (A) LASSO cross-validation analysis for selecting key indices, showing the optimal λ (lambda) values using the minimum criteria (Min) and the 1 standard error (1SE) criteria. (B) Heatmap of coefficients of the selected indices under Min and 1SE criteria. EOMCI, early-onset mild cognitive impairment; BMI, body mass index; WC, waist circumference; ABSI, A body shape index; BRI, body roundness index; VFA, visceral fat area; BF%, body fat percentage; SMMI, skeletal muscle mass index; GNRI, geriatric nutritional risk index; PNI, prognostic nutritional index; CALLY, C-reactive protein-albumin-lymphocyte index; FAR, fibrinogen to albumin ratio.
FIGURE 5
FIGURE 5
Interaction and simple slopes analysis of body composition and nutritional inflammatory indices on the risk of early-onset mild cognitive impairment (EOMCI). (A1–A3) Interaction between C-reactive protein-albumin-lymphocyte index (CALLY) and skeletal muscle mass index (SMMI) on EOMCI risk. (A1) Interaction effect of CALLY and SMMI across SMMI tertiles. (A2) Simple slopes of CALLY on EOMCI risk at SMMI tertiles. (A3) Johnson-Neyman plot showing the significance region of CALLY’s effect on EOMCI risk across SMMI values. (B1–B3) Interaction between geriatric nutritional risk index (GNRI) and A body shape index (ABSI) on EOMCI risk. (B1) Interaction effect of GNRI and ABSI across ABSI tertiles. (B2) Simple slopes of GNRI on EOMCI risk at different ABSI tertiles. (B3) Johnson-Neyman plot showing the significance region of GNRI’s effect on EOMCI risk across ABSI values. All analyses are based on generalized linear models and adjusted for age, sex, marital status, education level, diabetes duration, HbA1c, FPG, hypoglycemia frequency, smoking status, regular exercise, diabetes dietary control, UACR, AST, and Hb.

Similar articles

References

    1. Aatsinki S. M., Elkhwanky M. S., Kummu O., Karpale M., Buler M., Viitala P., et al. (2019). Fasting-Induced transcription factors repress Vitamin D bioactivation, a mechanism for vitamin D deficiency in diabetes. Diabetes 68 918–931. 10.2337/db18-1050 - DOI - PMC - PubMed
    1. American Medical Association. (2023). AMA Adopts New Policy Clarifying Role of BMI as a Measure in Medicine. Chicago, IL: American Medical Association.
    1. Anita N. Z., Zebarth J., Chan B., Wu C. Y., Syed T., Shahrul D., et al. (2022). Inflammatory markers in type 2 diabetes with vs. without cognitive impairment; A systematic review and meta-analysis. Brain Behav. Immun. 100 55–69. 10.1016/j.bbi.2021.11.005 - DOI - PubMed
    1. Arce Renteria M., Gillett S. R., McClure L. A., Wadley V. G., Glasser S. P., Howard V. J., et al. (2020). C-reactive protein and risk of cognitive decline: The REGARDS study. PLoS One 15:e0244612. 10.1371/journal.pone.0244612 - DOI - PMC - PubMed
    1. Arosio B., Calvani R., Ferri E., Coelho-Junior H. J., Carandina A., Campanelli F., et al. (2023). Sarcopenia and cognitive decline in older adults: Targeting the muscle-brain axis. Nutrients 15:1853. 10.3390/nu15081853 - DOI - PMC - PubMed

LinkOut - more resources