. 2023 Nov 27;4(1):2300081.
doi: 10.1002/smsc.202300081. eCollection 2024 Jan.

Bright Semiconductor Quantum Dots Shed New Light on Precision Nanomedicine for Various Diseases

Affiliations

Bright Semiconductor Quantum Dots Shed New Light on Precision Nanomedicine for Various Diseases

Peisen Zhang et al. Small Sci. .

Abstract

Nanomaterials with diagnostic and therapeutic functions have exciting potential to reshape the landscape of precision medicine. Impressive progress has been made toward the design and production of innovative theranostic nanomaterials that improve disease care, motivated by their ability to simultaneously provide diagnostic information and therapeutic benefits. Herein, the state-of-the-art theranostic semiconductor quantum dots (QDs) are summarized, and the diverse types of QDs designed for the diagnosis and treatment of different diseases are discussed. The opportunities and benefits of QDs are highlighted throughout using in vitro and in vivo examples aimed at addressing various clinical challenges, including cancer, vascular dysfunctions, microbial infections, and medical tattoos. Over the past several years, this area has experienced enormous growth, particularly in preclinical animal imaging and therapy, which has brought the field closer to reaching human patients. Unfortunately, several barriers to clinical translation remain. Therefore, in addition to summarizing the key results from previous in vivo studies, the lessons learned from these studies are synthesized, perspective on the future steps needed for both fundamental studies and the clinical translation of theranostic QD nanotechnology to inform future QD design is provided.

Keywords: cancer; medical tattoo; microbial infection; semiconductor quantum dots; vascular dysfunction.


Conflict of interest statement

The authors declare no conflict of interest.

Figures

Figure 1
Figure 1
a) Ultrasmall Ag2Se QDs were covered by an active oxygen layer after reaction with NaOH, allowing for facile incorporation of both active and inert metal ions (e.g., Ag2Se@X could be Ag2Se@Mn, Ag2Se@Cd, Ag2Se@Hg, Ag2Se@Cu as dual‐modal probes, and Ag2Se@X‐Y could be Ag2Se@Mn‐Cu and Ag2Se@Mn‐Y as trimodal probes). b) Multifunctional QDs@peptide conjugate was achieved by coupling octreotate peptide onto the surface of QDs. Specifically, Ag2Se@Mn‐64Cu QDs were used for NIR fluorescence, MRI, and PET imaging. Reproduced with permission.[ 35 ] Copyright 2019, Wiley‐VCH.
Figure 2
Figure 2
a) Scheme of CISe@ZnS:Mn QDs with built‐in multifunctionality. b) PL spectra of CISe@ZnS:Mn QDs with different Mn doping times. The dashed line depicts absorption by the sample doped for 2 h. c) PL QYs of QDs during 3 h of ZnS shell growth and subsequent 2 h of Mn doping. d) In vivo NIR‐II fluorescence imaging of subcutaneous tumors in mice, e) MR imaging of subcutaneous tumors, and f) lung metastasis of mice recorded at different time points after the intravenous injection of folic acid‐modified QDs (QD‐FA, probe) and mother QD. Scale bars: 5 mm. g) Relative tumor volumes after the phototherapy with the probe and other treatments. h) Representative images of 4T1 tumor tissues from each group harvested 20 days posttreatment. Reproduced with permission.[ 44 ] Copyright 2022, American Chemical Society.
Figure 3
Figure 3
a) A scheme of QD‐Cat‐RGD nanoprobe‐based RT that boosts the antitumor immune response and abscopal effect to inhibit cancer metastases. b) Whole‐body and high‐magnification fluorescent images of 4T1 tumor‐bearing mice intravenously injected with QD‐Cat‐RGD nanoprobes and imaged in the NIR‐II window. Scale bars: 5 mm. c) Histogram of 4T1 tumor weight. d) The ratio of M1/M2 macrophages in tumor microenvironment after treatment. e) Quantitative analysis of HIF‐1α immunostaining. Reproduced with permission.[ 51 ] Copyright 2021, Nature Publishing Group.
Figure 4
Figure 4
a) Upper: NIR‐II imaging of ischemic hindlimbs in mice. Fluorescence images both correspond to the time point of 10 s postinjection (p.i.). Scale bar: 2 cm. Lower: Representative laser Doppler spectroscopy images of ischemic limbs on days 3 and 7, respectively. b) Comparison of relative mean blood perfusion recovery in the ischemic limb by laser Doppler spectroscopy and NIR‐II fluorescence imaging. c) NIR‐II‐based quantification of blood flow rate. The dotted line denotes the mean flow rate of the control nonischemic limb. The arrow points to the ischemic limb (*p < 0.05, compared to day 0). d) Fluorescence images of mouse hind limb vasculature after induction of hind limb ischemia. Scale bar: 2 mm. Reproduced with permission.[ 62 ] Copyright 2018, Wiley‐VCH.
Figure 5
Figure 5
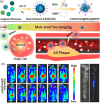
a) Illustration of the biomimetic dual‐emission ZAISe@ZnS@BSA@MMV preparation and its application for atherosclerotic plaque imaging. b) The typical NIR fluorescence images of ZAISe@ZnS@BSA@MMV in atherosclerotic plaque imaging at different time points. c) A bright field image (left) and fluorescent image (right) of resected aorta tissue after in vivo imaging. Reproduced with permission.[ 75 ] Copyright 2023, Elsevier.
Figure 6
Figure 6
a) Schematic diagram of synthesized PEGylated Zn‐doped Ag2Te QDs. b) Dynamic monitoring of TBI mouse brain and sham injury mouse brain with QD‐enhanced NIR‐II imaging. Reproduced with permission. [66c] Copyright 2022, Springer.
Figure 7
Figure 7
a) Preparation of the V&A@Ag2S probe and the timespan of NIR‐II fluorescence in brain vascular injury and healthy mice at different time points after injection of V@Ag2S, V&A@Ag2S, and A@Ag2S in vivo. Reproduced with permission.[ 87 ] Copyright 2020, Wiley‐VCH. b) Schematic illustration of the construction of the V&C/PbS@Ag2Se nanoprobe and detection of ONOO in ischemic stroke mice. Reproduced with permission.[ 92 ] Copyright 2021, Wiley‐VCH.
Figure 8
Figure 8
a) Schematic of the QDs&Fe2+@VVesicle composition and mechanism of ROS/RNS detection in vivo. b) Time‐dependent NIR‐II fluorescence images of JEV‐ and mock‐infected mice after intravenous injection of QDs&Fe2+@VVesicles. c) Quantification of the image intensities in frame b). Reproduced with permission.[ 108 ] Copyright 2022, Wiley‐VCH.
Figure 9
Figure 9
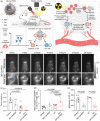
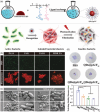
a) Preparation and antimicrobial application of QDs@pG/F. b) Fluorescence micrographs of four strains of P. aeruginosa (i.e., PA14, PAK, PAO1, and MDR PA), labeled with acridine orange (green, live bacteria) and ethidium bromide (red, bacteria with damaged membranes), after incubation with QDs@pG/F in the dark or when illuminated. c) Scanning electron microscope images of PA14 under different conditions: PBS (dark), PBS (illumination), QDs@pG/F30 (dark), and QDs@pG/F30 (illumination) and magnified views from the dashed circular frames. d) Photographs and quantified results of the twitching motility of PA14 with and without nanobiocides. Reproduced with permission.[ 117 ] Copyright 2021, the Royal Society of Chemistry.
Figure 10
Figure 10
a) PMMA‐encapsulated QD‐based fluorescent microparticles are distributed through an array of dissolvable microneedles in a distinct spatial pattern. Microneedles are then applied to the skin for 2 to 5 min, resulting in partial dissolution of the microneedle and retention of fluorescent microparticles. An NIR LED and an adapted smartphone are used to image patterns of fluorescent microparticles retained within the skin. b) Photograph of disassembled LED used for NIR illumination at 780 nm combined with an 800‐nm short‐pass filter and aspheric condenser. c) Photograph of disassembled NIR imaging smartphone with two external 850‐nm long‐pass filters set in a 3D‐printed phone case. Images of a 16‐needle microneedle patch containing PMMA‐encapsulated QDs were collected with the adapted smartphone under ambient indoor lighting d) without and e) with the pair of 850‐nm long‐pass filters under LED illumination. Inset shows an image at a higher exposure. f,h) Optical and g,i) SEM images of microparticle‐loaded microneedles f,g) before skin application and h,i) after administration to explanted pig skin. Adapted smartphone images of pigmented human skin before microneedle application j) without and k) with the 850‐nm long‐pass filters. Smartphone images of human skin after application l) without and m) with the 850‐nm long‐pass filters. n) Cropped, but otherwise raw, smartphone images collected from a fixed distance showing the intradermal NIR signal from PMMA‐encapsulated QDs delivered via microneedle patches on rats 0, 12, and 24 weeks after administration. Reproduced with permission.[ 14 ] Copyright 2019, American Association for the Advancement of Science.

Similar articles

References

    1. a) Doane T. L., Burda C., Chem. Soc. Rev. 2012, 41, 2885; - PubMed
    2. b) Shi J., Kantoff P. W., Wooster R., Farokhzad O. C., Nat. Rev. Cancer 2017, 17, 20; - PMC - PubMed
    3. c) Manzari M. T., Shamay Y., Kiguchi H., Rosen N., Scaltriti M., Heller D. A., Nat. Rev. Mater. 2021, 6, 351; - PMC - PubMed
    4. d) Pelaz B., Alexiou C., Alvarez-Puebla R. A., Alves F., Andrews A. M., Ashraf S., Balogh L. P., Ballerini L., Bestetti A., Brendel C., Bosi S., Carril M., Chan W. C., Chen C., Chen X., Chen X., Cheng Z., Cui D., Du J., Dullin C., Escudero A., Feliu N., Gao M., George M., Gogotsi Y., Grunweller A., Gu Z., Halas N. J., Hampp N., Hartmann R. K., Hersam M. C., et al., ACS Nano 2017, 11, 2313; - PMC - PubMed
    5. e) Huang Y., Ren J., Qu X., Chem. Rev. 2019, 119, 4357; - PubMed
    6. f) Sahay G., Alakhova D. Y., Kabanov A. V., J. Control Release 2010, 145, 182. - PMC - PubMed
    1. a) Durymanov M., Kamaletdinova T., Lehmann S. E., Reineke J., J. Control Release 2017, 261, 10; - PubMed
    2. b) Zhang P. S., Li Y. Y., Tang W., Zhao J., Jing L. H., McHugh K. J., Nano Today 2022, 42, 101335;
    3. c) Wheeler T. T., Cao P., Ghouri M. D., Ji T., Nie G., Zhao Y., Sci. China Chem. 2022, 65, 1498;
    4. d) Liu Q., Cheng H.-B., Ma R., Yu M., Huang Y., Li L., Zhao J., Nano Today 2023, 48, 101747;
    5. e) Yang B., Chen Y., Shi J., Chem. Rev. 2019, 119, 4881; - PubMed
    6. f) Zhang P., Meng J., Li Y., Yang C., Hou Y., Tang W., McHugh K. J., Jing L., Innovation 2021, 2, 100174. - PMC - PubMed
    1. a) Bjornmalm M., Thurecht K. J., Michael M., Scott A. M., Caruso F., ACS Nano 2017, 11, 9594; - PubMed
    2. b) Greish K., Mathur A., Bakhiet M., Taurin S., Ther. Delivery 2018, 9, 269; - PubMed
    3. c) Ren J., Andrikopoulos N., Velonia K., Tang H., Cai R., Ding F., Ke P. C., Chen C., J. Am. Chem. Soc. 2022, 144, 9184; - PubMed
    4. d) Kabanov A. V., Adv. Drug Delivery. Rev. 2006, 58, 1597. - PMC - PubMed
    1. a) Jing L., Kershaw S. V., Li Y., Huang X., Li Y., Rogach A. L., Gao M., Chem. Rev. 2016, 116, 10623; - PubMed
    2. b) Lesyuk R., Lesnyak V., Herguth A., Popovych D., Bobitski Y., Klinke C., Gaponik N., J. Mater. Chem. C 2017, 5, 11790.
    1. Jiao M., Portniagin A. S., Luo X., Jing L., Han B., Rogach A. L., Adv. Opt. Mater. 2022, 10, 2200226.

LinkOut - more resources