. 2024 Aug 1;5(1):2400112.
doi: 10.1002/smsc.202400112. eCollection 2025 Jan.

Functionalization of Silica Nanoparticles for Tailored Interactions with Intestinal Cells and Chemical Modulation of Paracellular Permeability

Affiliations

Functionalization of Silica Nanoparticles for Tailored Interactions with Intestinal Cells and Chemical Modulation of Paracellular Permeability

Claudia Iriarte-Mesa et al. Small Sci. .

Abstract

The intestinal compartment confines the gut microbiome while enabling food passage and absorption of active molecules. For the rational design of oral formulations aiming to overcome physiological barriers of the gut, it is crucial to understand how cells respond to the presence of nanoparticulate materials. Taking advantage of the versatility and biocompatibility of dendritic mesoporous silica nanoparticles (DMSNs), several post-grafting strategies are developed to diversify the surface properties of spherical DMSNs and then probe interactions with the intestinal coculture cell model Caco-2/HT29-MTX-E12. Herein, the functionalization of DMSNs with polyethylene glycol, phosphonate, methyl, and farnesol moieties enables the investigation of both particle penetration through the mucus layer and pathways relevant to intracellular uptake. Contributions of surface chemistry, charge, and colloidal stability are correlated with the modulation of particle movement through the mucus and the organization of cell-cell junctions. Hydrophilic and negative functionalities favor particle distribution toward the intestinal monolayer. Instead, hydrophobic DMSNs are hindered by the mucus, possibly limiting cell contact. Hybrid surfaces, combining phosphonate and long carbon chain functions, support diffusion through the mucus and foster the paracellular permeability as well as the transient barrier relapse, as indicated by increased cell-cell distances and reorganization of tight junctions.

Keywords: differentiated intestinal cells; membrane permeation; mesoporous silica nanoparticles; mucus barrier; surface functions; tight junction proteins.


Conflict of interest statement

The authors declare no conflict of interest.

Figures

Scheme 1
Scheme 1
Synthetic steps for the functionalization of DMSNs. In the TEM image of the calcined‐DMSNs, the scale bar represents 200 nm (see text for acronyms).
Figure 1
Figure 1
Representative transmission electron microscopy (TEM) images of functionalized DMSNs: a) D‐PEG, b) D‐PO 3 , c) D‐CH 3 , d) D‐Epox, e) D‐Farn, f) DPO 3 ‐CH 3 , g) DPO 3 ‐Epox, and h) DPO 3 ‐Farn. Scale bars represent 200 nm.
Figure 2
Figure 2
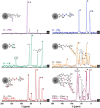
Solid‐state 13C CP NMR spectra of the functionalized silica nanoparticles: a) D‐PEG, b) D‐PO 3 , c) D‐CH 3 , d) D‐Farn, e) DPO 3 ‐CH 3 , and f) DPO 3 ‐Farn. The spectra of precursor samples (i.e., D‐Epox, D‐PO 3, and DPO 3 ‐Epox) were included within the respective panels (gray lines) for comparison.
Figure 3
Figure 3
a) Appearance of Caco‐2/HT29‐MTX‐E12 cells after treatment with FITC‐labeled particles (20× magnification). The control corresponds to non‐treated cells incubated in complete cell culture medium. Scale bars represent 100 μm. b) Quantification of the residual FITC fluorescence due to particle–cell interactions (%) with and without the mucus layer. c) Quantification of the focal plane adjustment obtained from the difference between the optical parameters set immediately after cell treatment with the FITC‐labeled particles (t 0) and after 6 h of incubation (t 6) with and without the mucus layer (t 0 –t 6). At least 18 paired images were analyzed (n = 18). d) Appearance of cell–cell distance of Caco‐2/HT29‐MTX‐E12 cells after 6 h of incubation with silica particles, measured from n ≥ 60 cells. Statistically significant differences according to one‐way ANOVA and Fisher tests when treatments are compared in the presence or absence of mucus (*), when the effect of mucus is compared for the same treatment (§), or when a specific treatment is compared with a group of others (#), are indicated with */§/# (p < 0.05), **/§§/## (p < 0.01), or ***/§§§/### (p < 0.001). For each condition, data were obtained from three independent cell preparations (biological triplicates) measured in technical duplicates. e) Schematic representation of cell accommodation upon particle treatment created with BioRender.com.
Figure 4
Figure 4
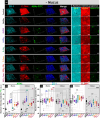
Representative immunofluorescence staining of ZO‐1 (cyan) and CLDN4 (red). The 3D reconstructions (63x magnification) were obtained by z‐stack imaging after incubation with N‐acetylcysteine (− Mucus) and 6 h treatment with FITC‐labeled silica nanoparticles (green). The control corresponds to non‐treated cells incubated in complete cell culture medium. The scale bar segmentation is 10 μm, and the nuclei are represented in blue (DAPI staining). Scale bars of the Z‐projection images of ZO‐1, CLDN4, and FITC channels for corresponding 3D reconstructions stand for 30 μm. Quantification of the mean fluorescence intensity of b) FITC, c) ZO‐1, and d) CLDN4, using maximum intensity projection images obtained from 3D reconstructions (n = 9). Statistically significant differences according to one‐way ANOVA and Fisher tests when treatments are compared in the presence or absence of mucus (*), when the effect of mucus is compared for the same treatment (§), or when a specific treatment is compared with a group of others (#), are indicated with */§/# (p < 0.05), **/§§/## (p < 0.01), or ***/§§§/### (p < 0.001). For CLDN4‐staining, maximum intensity projections corresponding to particle treatments after mucus removal were significantly lower than the respective values measured with mucus, which was indicated by &&& (p < 0.001). Data sets were obtained from three independent cell preparations (biological triplicates).
Figure 5
Figure 5
a) Representative immunofluorescence staining of TJs after 6 h treatment of Caco‐2/HT29‐MTX‐E12 cells with DPO 3 ‐Farn in the absence of mucus. The control corresponds to non‐treated cells incubated in complete cell culture medium. ZO‐1 staining is represented in cyan, CLDN4 in red, and the nuclei (stained with DAPI) in blue. Scale bars stand for 30 μm. Graphical representations of the XY‐thickness (d, μm) measured for ZO‐1 and CLDN4 stainings are included in the zoomed‐in images, whose scale bars stand for 5 μm. Schematic representations of the ZO‐1 and CLDN4 distributions were created with BioRender.com. Quantification of XY‐thickness (μm) of b) ZO‐1 and c) CLDN4 stainings after 6 h treatment with silica nanoparticles. Each dataset resulted from the analysis of n ≥ 60 cells from three independent preparations (biological triplicates). Statistically significant differences according to one‐way ANOVA and Fisher tests when treatments are compared in the presence or absence of mucus (*), when the effect of mucus is compared for the same treatment (§), or when a specific treatment is compared with a group of others (#), are indicated with */§/# (p < 0.05), **/§§/## (p < 0.01), or ***/§§§/### (p < 0.001). d) Transepithelial electrical resistance (TEER) upon treatment with nonfluorescent DPO 3 ‐Farn or in cell culture medium (control, i.e., non‐treated cells) in the absence of mucus. TEER was measured before cell treatment (+ Mucus), and the TEER (%) values were calculated as a percentage of the TEER obtained immediately after mucus removal (dashed line). All data were obtained from three independent cell preparations (biological triplicates) and are presented as mean ± standard deviations (n = 3). Student's t‐test confirmed significant differences between the TEER values corresponding to DPO 3 ‐Farn treatment and control in all the time slots measured after mucus removal (p < 0.001).
Figure 6
Figure 6
a) Appearance of Caco‐2/HT29‐MTX‐E12 cells after preincubation with Pitstop 2 (25 μM, 0.3% DMSO), mβCD (50 μM, 0.05% DMSO), and OA (100 μM, 0.03% DMSO) followed by 6 h treatment with FITC‐labeled particles in the absence of mucus (10× magnification). Scale bars stand for 200 μm. b–f) Quantification of the residual FITC fluorescence due to particle–cell interactions (%) with and without the mucus layer in control conditions, b) ‐ Pitstop 2 or c) ‐ mβCD/‐ OA, or after preincubation with d) Pitstop 2, e) mβCD, or f) OA, followed by particle treatments. g–k) Quantification of the focal plane adjustment obtained from the difference between the optical parameters set immediately after FITC‐labeled nanoparticles treatment (t 0) and after 6 h incubation (t 6) with or without mucus layer in control conditions, g) ‐ Pitstop 2 or h) ‐ mβCD/‐ OA, or after preincubation with i) Pitstop 2, j) mβCD, or k) OA, followed by particle treatments. Experiments were performed in biological triplicates, and at least 9 paired images were analyzed (before and after focus adjustment, n = 9). Statistically significant differences according to one‐way ANOVA and Fisher tests when treatments are compared in the presence or absence of mucus (*), when the effect of mucus is compared for the same treatment (§), or when a specific treatment is compared with a group of others (#), are indicated with */§/# (p < 0.05), **/§§/## (p < 0.01), or ***/§§§/### (p < 0.001).

Similar articles

References

    1. Haddadzadegan S., Dorkoosh F., Bernkop‐Schnürch A., Adv. Drug Delivery Rev. 2022, 182, 114097. - PubMed
    1. Masloh S., Culot M., Gosselet F., Chevrel A., Scapozza L., Labouebe M. Z., Pharmaceutics 2023, 15, 1415. - PMC - PubMed
    1. Durán‐Lobato M., Niu Z., Alonso M. J., Adv. Mater. 2020, 32, 1901935. - PubMed
    1. Di Tommaso N., Gasbarrini A., Ponziani F. R., Int. J. Environ. Res. Public Health 2021, 18, 12836. - PMC - PubMed
    1. Vancamelbeke M., Vermeire S., Expert Rev. Gastroenterol. Hepatol. 2017, 11, 821. - PMC - PubMed

LinkOut - more resources