. 2024 Jan 22;4(3):2300221.
doi: 10.1002/smsc.202300221. eCollection 2024 Mar.

Emerging Multifunctional Carbon-Nanomaterial-Based Biosensors for Cancer Diagnosis

Affiliations

Emerging Multifunctional Carbon-Nanomaterial-Based Biosensors for Cancer Diagnosis

Jolitta S J Britto et al. Small Sci. .

Abstract

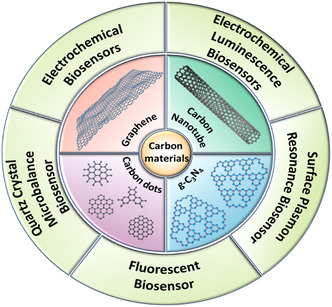
Despite significant advancements in medical technology, cancer remains the world's second-leading cause of death, largely attributed to late-stage diagnoses. While traditional cancer detection methodologies offer foundational insights, they often lack the specificity, affordability, and sensitivity for early-stage identification. In this context, the development of biosensors offers a distinct possibility for the precise and rapid identification of cancer biomarkers. Carbon nanomaterials, including graphene, carbon nitride, carbon quantum dots, and other carbon-based nanostructures, are highly promising for cancer detection. Their simplicity, high sensitivity, and cost-effectiveness contribute to their potential in this field. This review aims to elucidate the potential of emerging carbon-nanomaterial-based biosensors for early cancer diagnosis. The relevance of the various biosensor mechanisms and their performance to the physicochemical properties of carbon nanomaterials is discussed in depth, focusing on demonstrating broad methodologies for creating performance biosensors. Diverse carbon-nanomaterial-based detection techniques, such as electrochemical, fluorescence, surface plasmon resonance, electrochemiluminescence, and quartz crystal microbalance, are emphasized for early cancer detection. At last, a summary of existing challenges and future outlook in this promising field is elaborated.

Keywords: biomarkers; biosensors; cancer diagnosis; carbon nanomaterials; detection.


Conflict of interest statement

The authors declare no conflict of interest.

Figures

Figure 1
Figure 1
Different types of carbon nanomaterial biosensors based on their transducer operation.
Figure 2
Figure 2
The number of journal publications on three carbon nanostructures in the last years. The data of publication numbers are taken from the Web of Science.
Figure 3
Figure 3
Classification of cancer biomarkers and typical examples. BRCA1, breast cancer gene 1; BRCA2, breast cancer gene 2; COX 2, cyclooxygenase 2; DAPK, death‐associated protein kinase; EGFR, epidermal growth factor receptor; PCA3, prostate cancer antigen 3; P53, tumor protein 53; GSTP1, glutathione S‐transferase pi 1; DPC4, pancreatic cancer deletion gene4; KRAS, Kirsten rat sarcoma virus; CA15‐3, carcinoma antigen 15‐3; CEA, carcinoembryonic antigen (CEA); HER 2, human epidermal growth factor receptor 2; Mucin 1, mucin short variant S1; CYFRA 21‐1, cytokeratin 19 fragment antigen 21‐1; NSE, neuron‐specific enolase; VEGF, vascular endothelial growth factor; EpCAM, epithelial cell adhesion molecule; PSA, prostate‐specific antigen; PAP, pulmonary alveolar proteinosis; CA19‐9, cancer antigen 19‐9; CA242, carbohydrate antigen 242; CA125, cancer antigen 125.
Figure 4
Figure 4
Schematics of the working process of carbon‐nanomaterial‐based biosensors for early cancer diagnosis.
Figure 5
Figure 5
a) Graphical representation of rGO‐based immunosensor for HER‐2 protein. b) Effect of rGO on the intensity of ECL signals. c) The three consecutive ECL graphs of Bare, Bare + rGO‐CS‐Ru, Bare + rGO‐CS‐Ru+Ab, and Bare + rGO‐CS‐Ru + Ab+HER‐2. d) The ECL curves for GCE/rGO/CS‐[Ru(bpy)3]2+/Ab‐HER‐2 for different concentrations of HER‐2 protein (0.000001 to 1 nM). e) Calibration curve of ECL intensity of the final modified electrode at the corresponding concentrations of HER‐2 protein. f) ECL plots of investigation of the HER‐2 in untreated serum samples from breast cancer patients. a–f) Reproduced under the terms of the CC‐BY Creative Commons Attribution 4.0 International license (https://creativecommons.org/licenses/by/4.0).[ 214 ] Copyright 2021, The Authors, published by Springer Nature.
Figure 6
Figure 6
a) Schematics of fabrication procedure of the Ab1‐Fe3O4@GO and Ab2‐AuNPs/g‐C3N4 bio‐conjugates. b) The selectivity of the ECL biosensor in the blank, AFP, CEA, PSA, ALP, and SCCA. a,b) Reproduced with permission.[ 220 ] Copyright 2016, Elsevier. c) Schematic representation of S‐g‐CNQDs dual‐band ECL biosensor mechanism. d) Relationship between the ECL intensity and different concentrations (0, 50 fM, 0.1, 1 pM, 0.01, 0.1, 0.5–1 nM at 555 and 620 nm) of K‐RAS gene. e) The corresponding linear relationship of the ECL intensity and K‐RAS gene concentrations. c–f) Reproduced with permission.[ 229 ] Copyright 2019, American Chemical Society.
Figure 7
Figure 7
a) The electrochemical biosensing platform designed for protein detection is shown schematically. b) A comparison of the rGO with (left) and without (right) chitosan using TEM images. c) DPV curves for detecting a range of VEGFR2 concentrations, from: a) 0 to b) 0.3, c) 0.4, d) 0.9, e) 4.3, f) 8.6, g) 43, h) 65, i) 86, to j) 103 pM. d) The associated curve of calibration for (c). e) The sorafenib and vandetanib chemical formulas. Below is a representation of the respective binding models for VEGFR2‐sorafenib and VEGFR2‐vandetanib. a–e) Reproduced with permission.[ 242 ] Copyright 2014, Springer Nature.
Figure 8
Figure 8
Schematic diagram depicting the operational mechanism of the fluorescent biosensor for detecting small cell lung cancer biomarkers by neuron‐specific enolase antibodies (anti‐NSE)/amine nitrogen‐doped graphene quantum dots with AuNP. Reproduced with permission.[ 282 ] Copyright 2020, American Chemical Society.
Figure 9
Figure 9
a) Schematic diagram of the SPR biosensor equipped with the GO‐linking layer. b) SPR profiles of the unmodified gold sensor chip, monolayer graphene chip, and GO chip. c) The sensitivity to alterations in the refractive index of the respective SPR biosensor chips. a–c) Reproduced with permission.[ 305 ] Copyright 2015, American Chemical Society. d) Schematic illustration of QCM‐based immunosensor. e) QCM curves (frequency vs time) of (i) anti‐IL‐6‐Ab1/AuNPs/S‐GQD/QCM, (ii) IL‐6/anti‐IL‐6‐Ab1/AuNPs/S‐GQD/QCM, and (iii) anti‐IL‐6‐Ab2/ASP‐h‐ZnS‐CdS NC conjugated to IL‐6/anti‐IL‐6‐Ab1/AuNPs/S‐GQD/QCM. f) Concentration effect on QCM frequency. The inset shows the corresponding calibration curve. d–f) Reproduced with permission.[ 321 ] Copyright 2021, Elsevier.

Similar articles

Cited by

References

    1. Hanahan D., Cancer Discov. 2022, 12, 31. - PubMed
    1. Fitzgerald R. C., Antoniou A. C., Fruk L., Rosenfeld N., Nat. Med. 2022, 28, 666. - PubMed
    1. Siegel R. L., Miller K. D., Wagle N. S., Jemal A., CA: Cancer J. Clin. 2023, 73, 17. - PubMed
    1. Kim M. H., Choi G., Elzatahry A., Vinu A., Choy Y. B., Choy J. H., Clays Clay Miner. 2016, 64, 115. - PMC - PubMed
    1. Tabish T. A., Zhang S., Winyard P. G., Redox Biol. 2018, 15, 34. - PMC - PubMed

LinkOut - more resources