. 2025 Apr 25:10:38.
doi: 10.12688/wellcomeopenres.23515.3. eCollection 2025.

Drosophila AHR limits tumor growth and stem cell proliferation in the intestine

Affiliations

Drosophila AHR limits tumor growth and stem cell proliferation in the intestine

Minghua Tsai et al. Wellcome Open Res. .

Abstract

Background: The aryl hydrocarbon receptor (AHR) plays important roles in intestinal homeostasis, limiting tumour growth and promoting differentiation in the intestinal epithelium. Spineless, the Drosophila homolog of AHR, has only been studied in the context of development but not in the adult intestine.

Methods: The role of Spineless in the Drosophila midgut was studied by overexpression or inactivation of Spineless in infection and tumour models and RNA sequencing of sorted midgut progenitor cells.

Results: We show that spineless is upregulated in the adult intestinal epithelium after infection with Pseudomonas entomophila ( P. e.). Spineless inactivation increased stem cell proliferation following infection-induced injury. Spineless overexpression limited intestinal stem cell proliferation and reduced survival after infection. In two tumour models, using either Notch RNAi or constitutively active Yorkie, Spineless suppressed tumour growth and doubled the lifespan of tumour-bearing flies. At the transcriptional level it reversed the gene expression changes induced in Yorkie tumours, counteracting cell proliferation and altered metabolism.

Conclusions: These findings demonstrate a new role for Spineless in the adult Drosophila midgut and highlight the evolutionarily conserved functions of AHR/Spineless in the control of proliferation and differentiation of the intestinal epithelium.

Keywords: Drosophila; aryl hydrocarbon receptor; intestinal epithelium; spineless; tumour suppressor.

Plain language summary

The transcription factor aryl hydrocarbon receptor (AHR) plays important roles in the intestine, limiting tumour growth and promoting the normal epithelial lining. Spineless, the fruit fly homolog of AHR, has only been studied in the context of embryonic development but not in the intestine of adult flies. Here, we show that spineless is upregulated in the adult intestinal epithelium after infection with a bacterium. Blocking Spineless function increased stem cell proliferation after bacterial infection. Increasing Spineless had the opposite effect and limited intestinal stem cell proliferation. It also reduced survival after bacterial infection. In two separate tumour models, Spineless suppressed tumour growth and doubled the lifespan of tumour-bearing flies. Increasing Spineless reversed the gene expression changes induced in tumours, counteracting cell proliferation and changes to the cellular metabolism. These findings demonstrate a new role for Spineless in the adult fruit fly midgut and highlight the evolutionarily conserved functions of mammalian AHR and fruit fly Spineless in the control of proliferation and differentiation of the intestinal epithelium.


Conflict of interest statement

No competing interests were disclosed.

Figures
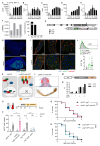
Figure 1.
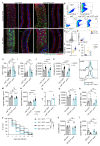
Figure 1.. Spineless limits intestinal stem cell proliferation after Pseudomonas entomophila infection.
A-E) Gene expression was determined by qPCR from isolated midguts of w1118 flies at different timepoints after P. entomophila infection. Data are from one experiment with n=3 samples per timepoint. Gene expression was normalized to Rpl32 and uninfected controls. F) RNA-Sequencing data obtained from flygutseq.buchonlab.com (Dutta et al., Cell Reports 2015). Spineless gene expression in different intestinal cell populations and induction 48h after P. entomophila infection is shown. G) Schematic of the targeting contstruct to generate ssGFP flies where GFP is inserted at the C-terminus of the spineless gene. H) ssGFP expression is visible in the antenna imaginal disk of L3 larvae from ssGFP flies. Images are from one experiment. Scale bars: 50µm. I) Representative fluorescent images of the midgut of w1118 and ssGFP flies 24h after P. entomophila infection. Scale bars: 50µm. J) GFP expression was analysed by flow cytometry in the midguts of naive w1118 and naive and P. entomophila infected ssGFP flies 24h after infection. A representative histogram and quantification of GFP + cells is shown. Data are pooled from 2 independent experiments. K) Schematic of spineless inactivation using ssGFP flies and membrane-anchored anti-GFP antibody. L) Representative images of aristapedia and leg phenotypes typical of ss mutant flies were seen in rn-Gal4, uas- anti-GFP, ssGFP flies. These flies also exhibited a pharate lethal phenotype. Data are from one experiment. M) Schematic of the transgene construct to generate spineless overexpressing flies. N) Gene expression was determined by qPCR in the midgut of naive flies incubated at 18°C or 29°C. Gene expression was normalized to Rpl32. Data are from one experiment with n=3 samples per genotype and temperature. O) Schematic of P. entomophila infection. P) The number of pHH3 + cells per midgut was quantified at 24h post P. entomophila infection. Data are from 3 independent experiments, n=5-10 per genotype and were analysed by 2-way ANOVA with Sidak correction for multiple comparisons. Q, R) Survival following P. entomophila infection. Data are pooled from 3 independent experiments, n=230-300 flies per genotype and compared using Log-Rank test of survival curves. P.e., Pseudomonas entomophila; RPKM, reads per kilobase per million; ISC, intestinal stem cells; EB, enteroblasts; EC, enterocytes; EE, enteroendocrine cells.
Figure 2.
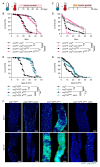
Figure 2.. Spineless overexpression reduces survival through ISC- and EB-specific effects.
A) Representative images of P. entomophila infected midguts at 24h post infection. B- E) Gating strategy to analyse ISC and EB populations in the midgut of naïve flies by flow cytometry. Each sample is from n=2 pooled midguts. B) Exclusion of doublets and dead cells. C) GFP expression is shown for different genotypes. Cells were pre-gated on live, single cells as shown in B. D) GFP high and GFP low subsets amongst GFP + cells. E) Comparison of size and granularity of the GFP high and GFP low subsets. F) Quantification of forward scatter (FSC) as a measure of cell size in GFP high and GFP low cells. G) Delta ( Dl) expression in GFP neg, GFP low and GFP high subsets was determined by qPCR in FACS-sorted cells from naive esg ts>GFP flies and normalized to Rpl32. Data are pooled from two experiments, n=4–6 samples per cell type. H- N) Midguts from uninfected controls and at 24h post P. entomophila infection were analysed by flow cytometry. Each datapoint is from n=2 pooled midguts. H, I) Quantification of GFP low and GFP high cell numbers per midgut. J, K) Mean fluorescent intensity for FSC (cell size) in GFP low and GFP high populations. L) Representative flow cytometry plots depicting GFP fluorescent intensity in GFP + cells. M, N) Geometric mean fluorescent intensity of GFP in GFP low and GFP high populations. H- K, M, N) Data are pooled from 2 independent experiments, n=13-14 samples per genotype. O) Escargot ( esg) expression was determined by qPCR in FACS sorted GFP high cells from naïve flies and gene expression was normalized to Rpl32. Data are pooled from 2 independent experiments for n=4–5 samples per genotype and were analysed by t-test. P- T) P. entomophila infection in flies overexpressing spineless specifically in ISC ( esg-Gal4, Su(H)-Gal80, tub-Gal80 ts ) or in EB ( Su(H)-Gal4, tub-Gal80 ts ). P) Survival following P. entomophila infection. Data are pooled from 2 independent experiments, n=295–339 flies per genotype and were compared using Log-Rank test of survival curves with Bonferroni correction for multiple comparisons. Q, R) Fluorescent intensity of FSC and GFP in ISC populations from uninfected controls and at 24h post P. entomophila infection in esg-Gal4, Su(H)-Gal80, tub-Gal80 ts flies. Data are from one experiment with n=5–8 samples per genotype and for each sample 2 midguts were pooled. S, T) P. entomophila infection in flies overexpressing spineless specifically in EB ( Su(H)-Gal4, tub-Gal80 ts ). Fluorescent intensity of FSC and GFP in EB populations from uninfected controls and at 24h post P. entomophila infection. Data are from one experiment with n=5–8 samples per genotype and for each sample 2 midguts were pooled. H- K, M, N, Q- T) Data were analysed by 2way-ANOVA with Tukey correction for multiple comparisons. P.e., Pseudomonas entomophila.
Figure 3.
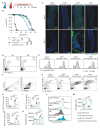
Figure 3.. Spineless prevents tumour formation in the Notch RNAi tumour model.
A) Schematic of Notch RNAi tumour model. B) Survival of flies with spineless inactivation and controls in the Notch RNAi tumour model. Data are pooled from 2 independent experiments, n=189-297 flies per genotype. C) Schematic of Notch RNAi tumour model with 24h low-dose P. entomophila infection. D) Survival of flies with spineless inactivation and controls in the Notch RNAi tumour model with 24h low-dose P. entomophila infection. Data are from two experiments with n=166-265 flies per genotype. E) Survival of spineless overexpression and controls in the Notch RNAi tumour model. Data are pooled from 2 independent experiments, n=173-202 flies per genotype. F) Representative fluorescent images of controls and spineless overexpressing flies at different timepoints of the Notch RNAi tumour model. Scale bars: 50µm. G) Survival of spineless overexpression and controls in the Notch RNAi tumour model with 24h low-dose P. entomophila infection. Data are from two experiments with n=187-232 flies per genotype. B, D, E, G) Data were analysed using Log-Rank test of survival curves and Bonferroni correction for multiple testing.
Figure 4.
Figure 4.. Spineless delays tumour formation in the yki act tumour model.
A) Schematic of yki act tumour model. B) Survival of spineless overexpression and controls in the yki act tumour model. Data are pooled from 2 independent experiments, n=409-592 flies per genotype and compared using Log-Rank test of survival curves with Bonferroni correction for multiple comparisons. C) Representative fluorescent images of controls and spineless overexpressing flies at different timepoints after induction of the yki act tumour model. Scale bars: 50µm. D, E) Comparison of GFP expression at 24h and 48h after temperature shift from 18°C to 29°C. Cells were pre-gated on live, single cells. Data are from one experiment with n=3-5 samples per genotype and each sample is pooled from 2 midguts. D) FSC and GFP fluorescence in esg ts>GFP.NLS flies. E) Comparison of GFP intensity across different genotypes. F- M) Flow cytometric analysis of midguts from day 2 of tumour induction at 29°C. Data are from n=4 samples (each sample is pooled from 24-30 midguts) and were analysed by 2-way ANOVA with Tukey correction for multiple comparisons. F, G) Representative flow cytometry plots of the gating of live, single cells ( F) and GFP expressing cells as a percentage of live, single cells ( G). H- K) Quantification of GFP + cells, GFP low and GFP high populations and cell size of GFP + cells. L) Representative flow cytometry plots of GFP intensity within GFP + cells. M) Quantification of GFP fluorescent intensity within GFP + cells.
Figure 5.
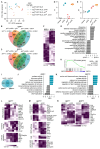
Figure 5.. Spineless alters cell metabolism, proliferation and differentiation in midgut progenitors.
Bulk RNA sequencing was conducted on sorted GFP low and GFP high cell populations 48h after temperature shift from 18°C to 29°C in the indicated genotypes. A) Principle component analysis of sequenced GFP low and GFP high samples. B, C) Overlap of differentially expressed genes (adjusted p value <0.05, |FC|>2). 3388 unique genes were differentially expressed between the different genotypes across all ISC samples ( B) and 3211 unique genes across all EB samples ( C). D, E) Expression of ss and yki in sequenced samples is depicted in log 10 (raw counts +1). F) Heatmap of differentially expressed genes between GFP low and GFP high populations in control flies ( esg ts>GFP.NLS). Shown are 484 genes upregulated and 702 genes downregulated in GFP high vs. GFP low cells with p adj<0.05 and |log 2(FC)|>1. G) Gene set enrichment analysis comparing GFP high vs. GFP low cells from esg ts>GFP.NLS flies. Selected pathways with p<0.05 are shown. H) Gene set enrichment analysis comparing GFP high vs. GFP low cells from esg ts>GFP.NLS flies against known marker genes of EB (reference 35) showing positive enrichment of EB marker genes in GFPhigh cells. I) Number of differentially expressed genes between esg ts>GFP.NLS,ssHA and esg ts>GFP.NLS samples (padj<0.05, |FC|>2). I, J) Gene set enrichment analysis comparing J) GFP low and K) GFP high cells from esg ts>GFP.NLS,ssHA to esg ts>GFP.NLS samples. Selected pathways with p<0.05 are shown. L), M) Examples of genes from the leading edge of enriched pathways shown in J) and K). N) Key genes involved in midgut stem cell maintenance and differentiation. L- N) Genes with significant differential expression (p adj<0.05, |FC|>2) are denoted by *.
Figure 6.
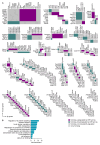
Figure 6.. Regulation of evolutionarily conserved genes by Spineless and AHR.
A) Homology between mouse genes regulated by AHR and fly genes regulated by Spineless. Beyond the homolog clusters, genes are arranged in no particular order. B) Gene ontology analysis using DAVID of AHR-regulated mouse genes with homology to fly genes with differential expression between esg ts>GFP.NLS,ssHA and esg ts>GFP.NLS samples. Selected pathways are shown.
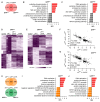
Figure 7.
Figure 7.. Spineless reverses effects of yki act tumour on gene expression.
A) Number of differentially expressed genes between esg ts>GFP.NLS,yki act and esg ts>GFP.NLS samples (padj<0.05, |FC|>2). B, C) Gene set enrichment analysis comparing B) GFP low and C) GFP high cells from esg ts>GFP.NLS,yki act to esg ts>GFP.NLS samples. Selected pathways are shown. D, E) Hierarchical clustering of genes differentially expressed between esg ts>GFP.NLS,yki act and esg ts>GFP.NLS samples. D) 2023 genes with differential expression in ISC are shown. E) 1859 genes with differential expression in EB are shown. F, G) Simple linear regression analysis of F) 946 genes in B) GFP low cells and G) 741 genes in GFP high cells that are differentially expressed in both comparisons of esg ts>GFP.NLS,yki act to esg ts>GFP.NLS and of esg ts>GFP.NLS,yki act,ssHA to esg ts>GFP.NLS,yki act . H) Number of differentially expressed genes between esg ts>GFP.NLS,yki act to esg ts>GFP.NLS,yki act,ssHA samples or between esg ts>GFP.NLS,yki act,ssHA to esg ts>GFP.NLS,ssHA samples (padj<0.05, |FC|>2). I, J) Gene set enrichment analysis comparing I) GFP low and J) GFP high cells from esg ts>GFP.NLS,yki act to esg ts>GFP.NLS,yki act,ssHA samples. Selected pathways are shown.
Figure 8.
Figure 8.. Schematic of Spineless function in the intestine.
At steady state ISC undergo self-renewal in symmetric divisions or asymmetric divisions in to ISC and EB, which in turn give rise to mature enterocytes. Spineless is expressed at low levels during steady state. Bacterial infection leads to epithelial damage and stem cell proliferation to regenerate the epithelium. Spineless overexpression blocks ISC proliferation and reduces survival while spineless inactivation increases ISC proliferation. In tumour models, spineless overexpression blocks tumour growth and promotes differentiation thereby prolonging fly survival. Spineless inactivation accelerates tumour growth and decreases lifespan. EB, enteroblast; EC, enterocyte; ISC, intestinal stem cell; ss, spineless.

Similar articles

References

    1. Stockinger B, Shah K, Wincent E: AHR in the intestinal microenvironment: safeguarding barrier function. Nat Rev Gastroenterol Hepatol. 2021;18(8):559–70. 10.1038/s41575-021-00430-8 - DOI - PMC - PubMed
    1. McGuire J, Okamoto K, Whitelaw ML, et al. : Definition of a dioxin receptor mutant that is a constitutive activator of transcription: delineation of overlapping repression and ligand binding functions within the PAS domain. J Biol Chem. 2001;276(45):41841–9. 10.1074/jbc.M105607200 - DOI - PubMed
    1. Diny NL, Schonfeldova B, Shapiro M, et al. : The Aryl Hydrocarbon Receptor contributes to tissue adaptation of intestinal eosinophils in mice. J Exp Med. 2022;219(4): e20210970. 10.1084/jem.20210970 - DOI - PMC - PubMed
    1. Metidji A, Omenetti S, Crotta S, et al. : The environmental sensor AHR protects from inflammatory damage by maintaining Intestinal Stem Cell homeostasis and barrier integrity. Immunity. 2018;49(2):353–362. e5. 10.1016/j.immuni.2018.07.010 - DOI - PMC - PubMed
    1. Shah K, Maradana MR, Joaquina Delàs M, et al. : Cell-intrinsic Aryl Hydrocarbon Receptor signalling is required for the resolution of injury-induced colonic stem cells. Nat Commun. 2022;13(1): 1827. 10.1038/s41467-022-29098-7 - DOI - PMC - PubMed

LinkOut - more resources