. 2025 Mar 27:16:1547832.
doi: 10.3389/fpls.2025.1547832. eCollection 2025.

Estimating photosynthetic characteristics of forage rape by fusing the sensitive spectral bands to combined stresses of nitrogen and salt

Affiliations

Estimating photosynthetic characteristics of forage rape by fusing the sensitive spectral bands to combined stresses of nitrogen and salt

Jingang Wang et al. Front Plant Sci. .

Abstract

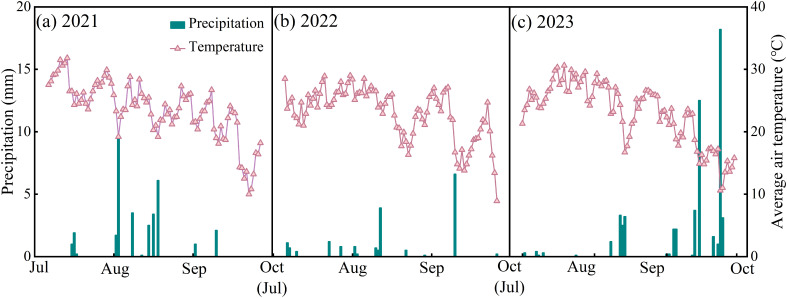
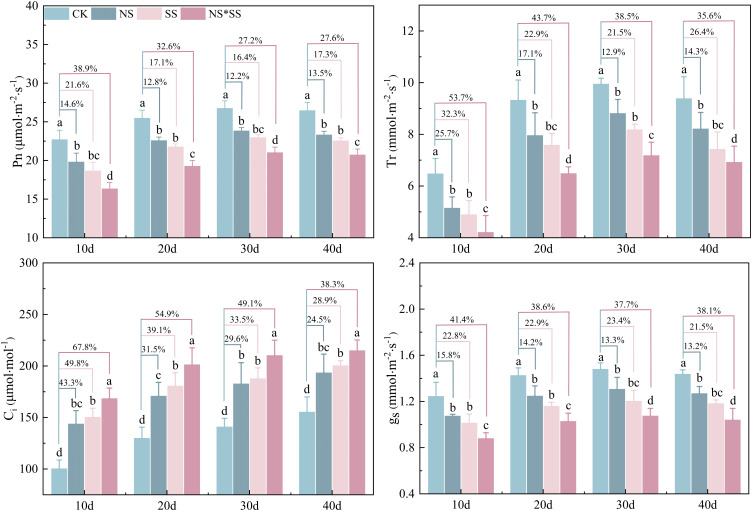
Leaf gas exchange and chlorophyll fluorescence parameters (PGE-CFPs), which respond significantly and quickly to environmental stresses, have been used to assess the early responses of crop physiology to stresses. Most spectral estimations only focus on crop photosynthetic characteristics under a single environmental stress. Thus, the methods proposed previously are not suitable for the estimations under combined stresses (i.e., nitrogen and salt). In this research, the leaf spectral features of forage rape (Brassica napus L.) under nitrogen stress (NSpe) and salt stress (SSpe) were fused to increase the accuracy of the spectral estimation of photosynthetic characteristics of forage rape under combined stresses in arid region of Xinjiang, China. The results showed that PGE-CFPs' spectral features were extracted with SPA (successive projections algorithm) after preprocessing. Among the SSpe- and NSpe-based models, the RF (random forest) models had higher estimation accuracy than the PLSR (partial least squares regression) and BPNN (backpropagation neural network) models. Specifically, the RF models had a PGE-CFPs estimation accuracy of 0.597-0.712, 0.640-0.715, and 0.377-0.461 under nitrogen stress (NS), salt stress (SS), and NS*SS, respectively. After fusing NSpe and SSpe, the accuracy in estimating PGE-CFPs of forage rape under NS, SS, and NS*SS were 0.729-0.755, 0.667-0.768, and 0.621-0.689, respectively. Then, the constructed models were further validated using field data, and the accuracy obtained was in the range of 0.585-0.711. Therefore, the feature fusion modeling method proposed has strong transferability and applicability. This research will offer a technical reference for crop photosynthesis monitoring at the early stage of environmental stresses.

Keywords: combined stresses; continuous wavelet transform; feature fusion; hyperspectral technology; photosynthetic systems.


Conflict of interest statement

The authors declare that the research was conducted in the absence of any commercial or financial relationships that could be construed as a potential conflict of interest.

Figures

Figure 1
Figure 1
Daily average air temperature and precipitation during forage rape growing season from 2021 to 2023.
Figure 2
Figure 2
Statistical analysis of gas exchange and chlorophyll fluorescence parameters (PGE-CFPs) of forage rape leaves (n = 240). The central lines in the boxplot represent the medians, and the upper and lower boundaries of the extension lines represent the maximum and minimum values, respectively. CK, NS, SS, and NS*SS are control, nitrogen stress, salt stress, and nitrogen-salt combined stresses, respectively; Pn, Net photosynthetic rate; Ci, Intercellular carbon dioxide concentration; gs, Stomatal conductance; Tr, Transpiration rate; ΦPS II, Effective quantum yield of PS II photochemistry; Fv/Fm, Maximum photochemical efficiency of PS II; Fv/F0, PSII potential activity; qP, Photochemical quenching coefficient; NPQ, Non-photochemical quenching; ETR, Electron transport rate.
Figure 3
Figure 3
Construction of models by fusing the spectral features of gas exchange and chlorophyll fluorescence parameters (PGE-CFPs) of forage rape leaves under nitrogen and salt stresses.
Figure 4
Figure 4
Changes in gas exchange parameters (PGEs) of forage rape leaves under nitrogen stress, salt stress, and nitrogen-salt combined stresses. Different lowercase letters indicate significant differences between treatments (p < 0.05), and the percentages in the same group indicate the changing amplitude of PGEs of forage rape leaves under NS, SS, and NS*SS compared with those of CK. The same below. CK, NS, SS, and NS*SS are control, nitrogen stress, salt stress, and nitrogen-salt combined stresses, respectively; Pn, Net photosynthetic rate; Ci, Intercellular carbon dioxide concentration; gs, Stomatal conductance; Tr, Transpiration rate; 10 d, 20 d, 30 d, and 40 d represent 10, 20, 30, and 40 days after sowing, respectively.
Figure 5
Figure 5
Changes of chlorophyll fluorescence parameters (CFPs) of forage rape leaves under nitrogen stress, salt stress, and nitrogen-salt combined stresses. CK, NS, SS, and NS*SS are control, nitrogen stress, salt stress, and nitrogen-salt combined stresses, respectively; Fv/F0, PS II potential activity; Fv/Fm, Maximum photochemical efficiency of PS II; qP, Photochemical quenching coefficient; NPQ, Non-photochemical quenching; ΦPS II, Effective quantum yield of PS II photochemistry; ETR, Electron transport rate. 10 d, 20 d, 30 d, and 40 d represent 10, 20, 30, and 40 days after sowing, respectively.
Figure 6
Figure 6
Changes of spectral reflectance of forage rape leaves under nitrogen stress, salt stress, and nitrogen-salt combined stresses. CK, NS, SS, and NS*SS are control, nitrogen stress, salt stress, and nitrogen-salt combined stresses, respectively.
Figure 7
Figure 7
Distribution of spectral features of gas exchange and chlorophyll fluorescence parameters (PGE-CFPs) of forage rape leaves under nitrogen stress, salt stress, and nitrogen-salt combined stresses. NS, SS, and NS*SS are nitrogen stress, salt stress, and nitrogen-salt combined stresses, respectively; Ci, Intercellular carbon dioxide concentration; Fv/Fm, Maximum photochemical efficiency of PS II; NPQ, Non-photochemical quenching; ETR, Electron transport rate.
Figure 8
Figure 8
Validation of random forest (RF) models for the estimation of gas exchange and chlorophyll fluorescence parameters (PGE-CFPs) of forage rape leaves under different stresses. (A), Validation of the RF models constructed using the spectral features of PGE-CFPs under nitrogen stress (NS); (B), Validation of the RF models constructed using the spectral features of PGE-CFPs under salt stress (SS); (C), Validation of the RF models constructed based on the fusion of spectral features under nitrogen-salt combined stresses (NS*SS). Ci, Intercellular carbon dioxide concentration; Fv/Fm, Maximum photochemical efficiency of PS II; NPQ, Non-photochemical quenching; ETR, Electron transport rate.
Figure 9
Figure 9
Validation of random forest (RF) model constructed based on the fusion of spectral features of gas exchange and chlorophyll fluorescence parameters (PGE-CFPs) of forage rape leaves under nitrogen stress (NS) and salt stress (SS). (A), Validation of the feature fusion model for the estimation of PGE-CFPs under NS; (B), Validation of the feature fusion model for the estimation of PGE-CFPs under SS; (C), Validation of the feature fusion model for the estimation of PGE-CFPs under nitrogen-salt combined stresses (NS*SS). Ci, Intercellular carbon dioxide concentration; Fv/Fm, Maximum photochemical efficiency of PS II; NPQ, Non-photochemical quenching; ETR, Electron transport rate.
Figure 10
Figure 10
Validation of the feature fusion model using the leaf data of independent forage rape plants (n = 160). Ci, Intercellular carbon dioxide concentration; Fv/Fm, Maximum photochemical efficiency of PS II; NPQ, Non-photochemical quenching; ETR, Electron transport rate.
Figure 11
Figure 11
The importance of spectral features in the ETR estimation based on random forest regression under different stresses. (A), The model constructed based on the spectral features of gas exchange and chlorophyll fluorescence parameters (PGE-CFPs) of forage rape leaves under nitrogen stress (NS); (B), The model constructed based on the spectral features of PGE-CFPs under salt stress (SS); (C), The model constructed based on the spectral features of PGE-CFPs under nitrogen-salt combined stresses (NS*SS); (D), The model constructed based on the fusion of spectral features of PGE-CFPs under NS and SS (NS-SS). ETR, Electron transport rate.

Similar articles

References

    1. Baker N. R., Rosenqvist E. (2004). Applications of chlorophyll fluorescence can improve crop production strategies: An examination of future possibilities. J. Exp. Bot. 55, 1607–1621. doi: 10.1093/jxb/erz535 - DOI - PubMed
    1. Barnes R., Dhanoa M., Lister S. (1993). Letter: Correction to the description of standard normal variate (SNV) and de-trend (DT) ransformations in practical spectroscopy with applications in food and everage analysis-2nd edition. J. Near Infrared Spectrosc. 1, 185–186. doi: 10.1255/jnirs.21 - DOI
    1. Berger K., Machwitz M., Kycko M., Kefauver S. C., Van Wittenberghe S., Gerhards M., et al. . (2022). Multi-sensor spectral synergies for crop stress detection and monitoring in the optical domain: a review. Remote Sens. environ. 280, 113198. doi: 10.1016/j.rse.2022.113198 - DOI - PMC - PubMed
    1. Breiman I. (2001). Random forest. Mach. learn. 45, 5–32. doi: 10.1023/A:1010933404324 - DOI
    1. Buschmann C., Langsdorf G., Lichtenthaler H. K. (2000). Imaging of the blue, green, and red fluorescence emission of plants: an overview. Photosynthetica 38, 483–491. doi: 10.1023/A:1012440903014 - DOI

LinkOut - more resources