. 2024 Oct 31;5(2):2400450.
doi: 10.1002/smsc.202400450. eCollection 2025 Feb.

Integrating Tumor Hypoxic Sensing and Photothermal Therapy Using a Miniaturized Fiber-Optic Theranostic Probe

Affiliations

Integrating Tumor Hypoxic Sensing and Photothermal Therapy Using a Miniaturized Fiber-Optic Theranostic Probe

Fangzhou Jin et al. Small Sci. .

Abstract

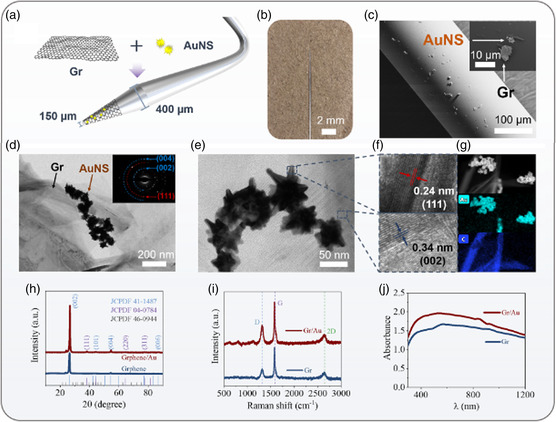
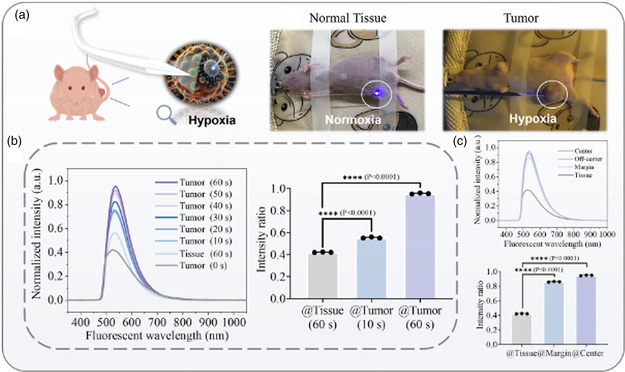
Efficient delivery of photons to visceral organs is critical for the treatment of deep-seated tumors taking advantage of photo theranostics. Optical fiber can be regarded as a direct and facile photon pathway for targeting tumor lesion. However, current fiber theranostic strategies rely on the spatially separated optical fibers to realize diagnosis and therapy independently, resulting in low compactness, poor continuity of medical process, and incompatibility with current medical technologies. Herein, an integrated fiber-optic theranostic (iFOT) probe is developed that merges tumor microenvironment sensing and photothermal therapy by functionalizing the fiber with graphene/gold nanostar hybrid materials and hypoxic-responsive fluorophores. The iFOT probe can quickly detect the hypoxia of xenograft tumors of mice with high sensitivity. The tumors can be photothermally killed on-site through the same fiber probe tightly followed by detection, which presents a high cure rate. More importantly, the iFOT is highly adaptable to the conventional medical imaging and endoscopic techniques, which facilitates the imaging-assisted navigation and manipulation by use of the interventional trocar. The proposed strategy can be used as an effective endoscopic and interventional tool for tackling deep-situated tumor and may open a revolutionized pathway to bridge separate diagnosis and therapy process in the current stage.

Keywords: imaging‐assisted navigation; microenvironment sensing; optical fibers; photothermal therapy; tumor theranostics.


Conflict of interest statement

The authors declare no conflict of interest.

Figures

Figure 1
Figure 1
Diagram of imaging‐compatible iFOT probe for tumor sensing and therapy. The construction of multifunctional fiber probe that integrates in vivo tumor detection and PTT. Nitroreductase (NTR) probes on fiber can fluorescently identify tumors through the interaction with the hypoxia markers and Gr/AuNS nanomaterials implement the photothermal conversion while boosting the fluorescent signal. In addition, the iFOT probe is compatible with multiple medical techniques, such as laparoscope, US imaging, MRI, and interventional surgery, which can facilitate the iFOT probe navigation inside the human body. Gr, graphene; AuNS, gold nanostar; FP, fluorescent probe; PL, pump laser; EL, excitation light; FL, fluorescent light.
Figure 2
Figure 2
The characterization of Gr/AuNS on fiber. a) Scheme of the preparation procedures of the Gr/AuNS fiber probe. b) Photography of the fiber tip. c) SEM images of the Gr/AuNS on fiber. d,e) TEM images of the Gr/AuNS nanostructure (the inset in Figure 2d is the corresponding). f) High‐resolution TEM images of the Gr/AuNS. g) Elemental mapping images of the Gr/AuNS nanostructure. h) XRD patterns, i) Raman spectra, and j) UV–vis spectra of the pure graphene and the Gr/AuNS.
Figure 3
Figure 3
Optimization of fiber‐optic probe. a) Scheme of the fiber probe design for optimizing fluorescence and photothermal effect. b) LOD and temperature regarding the optical fibers with different end diameters. c) Deformation of different fibers after vertical shifts. d) Rigidity of different fiber head structures in the puncture operation. e) The influence of graphene content on the photothermal conversion of the Gr/AuNS fiber. f) The influence of high graphene content for fiber fluorescence sensing. g) Sensing performance and calibration of the optical fiber probe (blank, pure graphene, and Gr/AuNS) for detecting NTR in vitro. Even though the fluorescence quenching effect of graphene decreases the fluorescence intensity, the downside is effectively improved by the combination strategy of graphene and AuNS. h) The influence of AuNS concentration on fluorescence sensing. The fluorescent signal went up as the increase of AuNS content. i) The ≈550 nm fluorescent signal of Gr/AuNS fiber increases with the increment of the NTR density. For a smaller detection range (0–30 ng mL−1), the curve could be approximately fitted in a linear regression function, I = 0.00278 × C + 0.46207 (R 2 = 0.983) (I: intensity; C: concentration of NTR). The LOD of the sensor can be obtained to ≈2.6 ng mL−1 and the LOQ of the sensor can be obtained to ≈8.5 ng mL−1, according to the equation of XLOD = f −1 (yblank¯ + 10/3 × σ) and XLOQ = f −1 (yblank¯ + 10 × σ); (f: function; yblank¯ : mean value of the blank sample tests; σ: standard deviation). Error bars are obtained by three dependent measurements. j) Photon‐induced temperature changes in the air using bare fiber, graphene fiber, AuNS fiber, and Gr/AuNS fiber as a function of the pump power. (Inset: the IR record of the temperature of Gr/AuNS fiber under the pump power of 160 mW).
Figure 4
Figure 4
Fluorescent sensing of iFOT for in situ tumor detection. a) Schematic diagram of in vivo fluorescence detection in tumor‐bearing mice and healthy mice. b) The fiber sensing was harnessed to intervene in the normal tissue and MDA‐MB‐231 tumor in the mirror spots, respectively. The intratumor manipulation was shown in the real experiment image and video S1 (Supporting Information). Other than the normal tissue that brings about little effective signal, the tumor allows the fluorescent signal accumulation with respect to time. The curve originates from the normal tissue providing a baseline for the quantitative analysis of the tumor‐associated fluorescent regarding the detection time. Even a 10 s test for tumors showed great significance in comparison with normal tissue, manifesting the fast and real‐time determination capability. ****P < 0.0001. c) The fiber sensing was harnessed to intervene in the different sites (center, off‐center, and margin) of the same MDA‐MB‐231 tumor, respectively. Fluorescent signal evolution with time accumulation at the center, off‐center, and margin of the tumor. Signal intensity is proportional to tumor density. ****P < 0.0001.
Figure 5
Figure 5
Tumor characterization and anticancer efficacy of the Gr/AuNS PTT fiber. a) Schematic diagram of photothermal conversion of iFOT and PTT of tumor in mice. b) Testing and characterization of the variation of the fiber thermal actuation range with pump power and time in vitro tissue. c) Temperature increment dictated by the step‐changed pump power. The inset image: the IR images that reveal the thermalization with the increment of pump power. d) Sensorgram of the photoheating in a demo of treatment in vivo. The entire process was recorded in Video S2, Supporting Information.
Figure 6
Figure 6
Anticancer efficacy of the fiber PTT. a) Scheme of one‐time PTT in vivo strategy. b,c) Tumor growth inhibition curves (the volume (mm3) = 1/2 × (tumor length) × (tumor width)2 of different groups (control, “F + G‐L”, “F + L‐G,” and “F + G + L” group) of tumor‐bearing mice after treatments (n = 6). d) Representative photographs of mice bearing MDA‐MB‐231 xenografts in different group sets before and after various treatments. Control group: control without any treatment; “F + G‐L” group: Gr/AuNS optical fiber without laser injection; “F + L‐G” group: the bare optical fiber with 200 mW laser injection; “F + G + L” group: the Gr/AuNS optical fiber with 200 mW laser injection. e) Histology analysis of therapeutic effects in MDA‐MB‐231 tumor sections regarding the different treatments and periods (n = 6). The scale bars of H&E are 100 μm, and the scale bars of Ki67 and Cleaved‐caspase 3 are 50 μm.
Figure 7
Figure 7
Optical fiber and image combination platform for biological applications. a) Scheme of the compatibility of iFOT with current imaging technology. b) Endoscopic guidance assisted in the laparoscopic simulation of tumor treatment experiment. The red temperature‐sensitive material sensing the high temperature of Gr/AuNS fibers caused the surface color variation, which can be observed clearly in the endoscope lens. c) Positioning of the fiber probe based on US guidance in the tumor of mice. d) The interventional theranostics of iFOT using phantom vessel with different curvatures. e) Positioning of the fiber probe based on MRI guidance in the tumor of mice. f) The movement of optical fibers in mouse tumors with MRI monitoring for 1 min. g) Continuous MRI monitoring of tumor tissue in 10 min (recorded per 100 s) to confirm the reliability of the optical fiber PTT strategy. And evolution of MRI signals in the solid tumor.

References

    1. a) Jin H., Wang L., Bernards R., Nat. Rev. Drug Discovery 2023, 22, 213; - PubMed
    2. b) Siegel R. L., Miller K. D., Wagle N. S., Jemal A., CA: Cancer J. Clin. 2023, 73, 17; - PubMed
    3. c) Sung H., Ferlay J., Siegel R. L., Laversanne M., Soerjomataram I., Jemal A., Bray F., CA: Cancer J. Clin. 2021, 71, 209; - PubMed
    4. d) Bray F., Laversanne M., Weiderpass E., Soerjomataram I., Cancer 2021, 127, 3029. - PubMed
    1. a) Xie Z., Fan T., An J., Choi W., Duo Y., Ge Y., Zhang B., Nie G., Xie N., Zheng T., Chen Y., Zhang H., Kim J. S., Chem. Soc. Rev. 2020, 49, 8065; - PubMed
    2. b) Lee G.-H., Moon H., Kim H., Lee G. H., Kwon W., Yoo S., Myung D., Yun S. H., Bao Z., Hahn S. K., Nat. Rev. Mater. 2020, 5, 149; - PMC - PubMed
    3. c) Zhou Z., Song J., Nie L., Chen X., Chem. Soc. Rev. 2016, 45, 6597. - PMC - PubMed
    1. a) Fröch J. E., Huang L., Tanguy Q. A., Colburn S., Zhan A., Ravagli A., Seibel E. J., Böhringer K. F., Majumdar A., eLight 2023, 3, 1; - PubMed
    2. b) Zhang L., Pleskow D. K., Turzhitsky V., Yee E. U., Berzin T. M., Sawhney M., Shinagare S., Vitkin E., Zakharov Y., Khan U., Nat. Biomed. Eng. 2017, 1, 0040; - PMC - PubMed
    3. c) Kennedy G. T., Azari F. S., Bernstein E., Nadeem B., Chang A., Segil A., Carlin S., Sullivan N. T., Encarnado E., Desphande C., Nat. Commun. 2022, 13, 2711. - PMC - PubMed
    1. a) Chin A. L., Jiang S., Jang E., Niu L., Li L., Jia X., Tong R., Nat. Commun. 2021, 12, 5138; - PMC - PubMed
    2. b) Li Z., Lan N., Cheng Z., Jin F., Song E., Xu Z., Zhang Y., Feng Y.-Z., Cai X., Ran Y., Chem. Eng. J. 2024, 493, 152495.
    1. Wu Y., Chen M., Cai J., Xu Z., Jin F., Zhang Y., Wang W., Ran Y., Zhang D., Guan B.-O., IEEE Sens. J. 2022, 22, 22646.

LinkOut - more resources