

Assessing Dosimetric Benefits of Cone Beam Computed Tomography-Guided Online Adaptive Radiation Treatment Frequencies for Lung Cancer
- PMID: 40213313
- PMCID: PMC11982956
- DOI: 10.1016/j.adro.2025.101740
Assessing Dosimetric Benefits of Cone Beam Computed Tomography-Guided Online Adaptive Radiation Treatment Frequencies for Lung Cancer
Abstract
Purpose: Online adaptive radiation therapy (oART) has shown the ability to diminish interfraction variations. However, oART is a time- and labor-intensive process, and the optimal adaptation frequency remains to be determined for lung cancer oART. The purpose of this study was to quantify and assess dosimetric benefits associated with various adaptive frequencies in patients with lung cancer receiving oART.
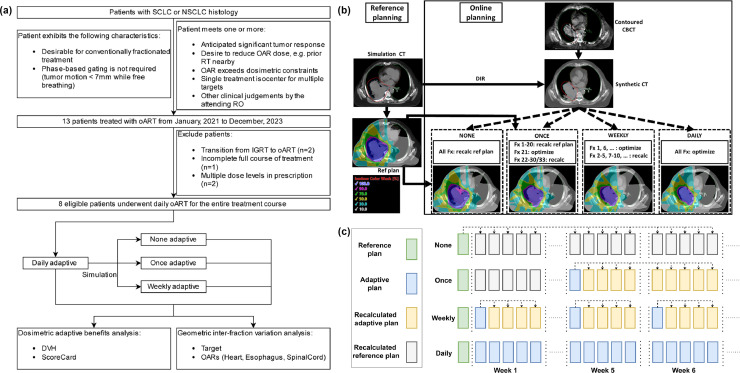
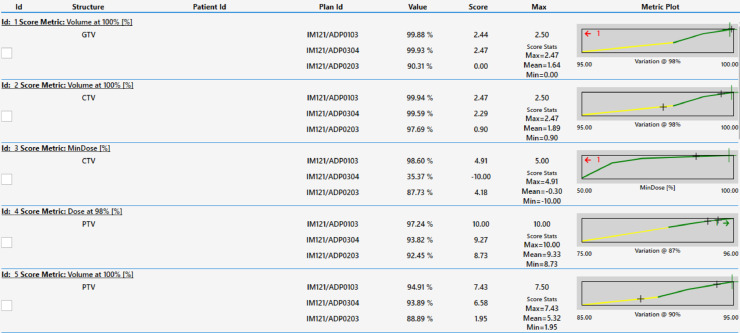
Methods and materials: This study included 8 patients with lung cancer receiving oART treated on the Ethos platform in 30 or 33 fractions (n = 7 /1). For a total of 243 fractions, daily contours on cone-beam computed tomography (CT) and adaptive/nonadaptive plans on synthetic CT scan were used to simulate 4 different adaptation frequencies: none, single, weekly, and daily adaptation, resulting in 972 unique dose distributions. Dose-volume-histograms of targets and organs-at-risk (OARs) were compared between adaptation frequencies. Besides Dose-volume-histogram analysis, 3 radiation oncologists reviewed and scored 185 total plans, evenly sampling plans from the various adaptive frequencies. A comprehensive plan scorecard was fine-tuned to correlate with physician reviews and subsequently used for interplan comparison.
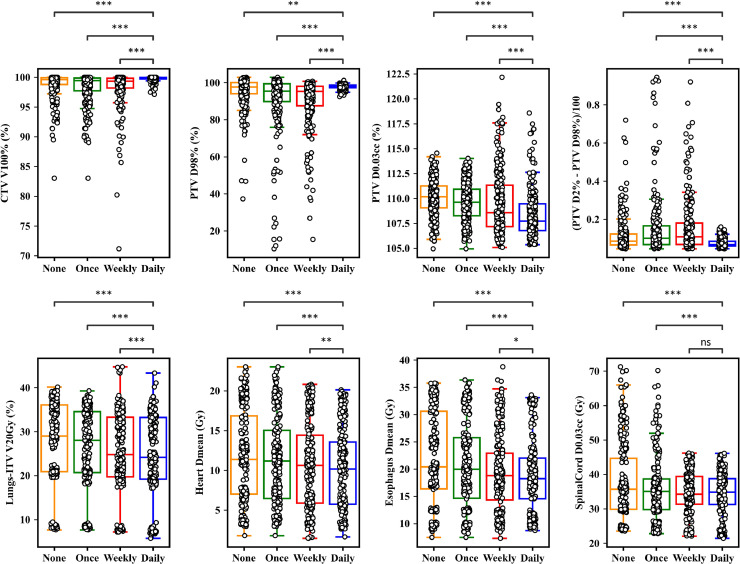
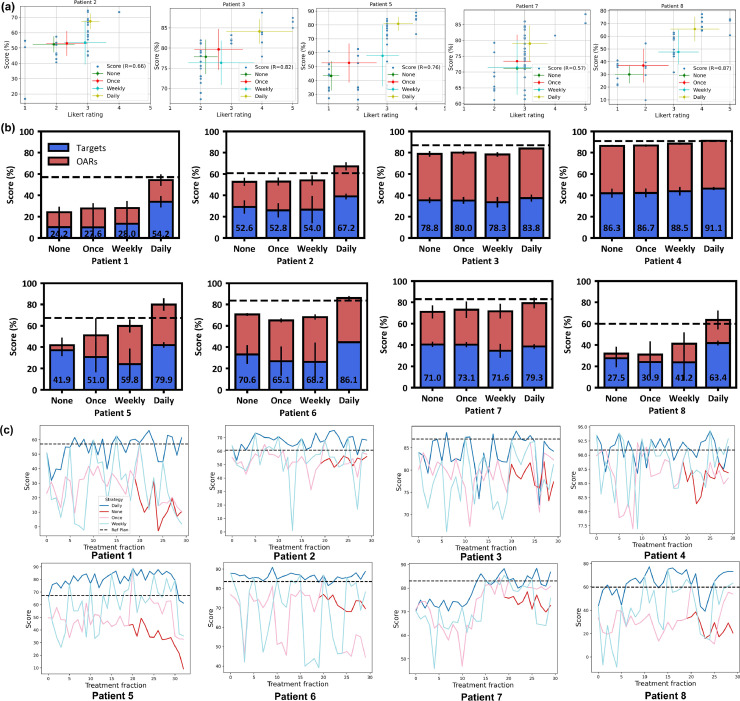
Results: Compared with no adaptation, daily adaptation improved the median clinical target volume V100% by 0.2% (IQR, 0.0-1.0) and the planning target volume D98% by 0.5% (IQR, -2.2 to 3.83). It also reduced the planning target volume D0.03cc by 2.1% (IQR, 0.7-3.2), the lungs-internal target volume V20 Gy by 2.5% (IQR, 1.0-4.5), the heart Dmean by 0.9 Gy (IQR, 0.4-2.6), and the esophagus Dmean by 1.6 Gy (IQR, 0.3-4.3). Single and weekly adaptation presented fewer benefits in OAR sparing and led to target undercoverage compared with daily adaptation. The PlanScoreCard effectively quantified plan quality, showing a positive monotonic correlation to physician scores (R = 0.57-0.87). It revealed that daily adaptation significantly improved total plan quality for 7 out of 8 patients, with improvements exceeding 5% of the plan score compared with no adaptation. In contrast, weekly and single adaptations led to improvements in only 2 and 1 patients, respectively.
Conclusions: Online kilovoltage cone-beam CT scan-guided daily adaptation may lead to dosimetric benefits in both target coverage and OAR sparing in patients with lung cancer. Other adaptation frequencies are effective for some patients but tend to lead to target undercoverage compared with daily adaptation.
© 2025 The Author(s).
Conflict of interest statement
Dennis Stanley has received research support, not related to this work, and speaker honoraria from Varian Medical Systems. Richard Popple has received research support, not related to this work, and speaker honoraria from Varian Medical Systems.
Figures
Similar articles
-
CBCT-based online adaptive radiotherapy of the prostate bed: first clinical experience and comparison to nonadaptive conventional IGRT.Strahlenther Onkol. 2025 Aug;201(8):767-778. doi: 10.1007/s00066-024-02323-6. Epub 2024 Nov 5. Strahlenther Onkol. 2025. PMID: 39499306 Free PMC article.
-
CBCT-based online adaptive radiotherapy of the bladder - geometrical and dosimetrical considerations compared to conventional IGRT.Radiat Oncol. 2025 Aug 14;20(1):128. doi: 10.1186/s13014-025-02710-y. Radiat Oncol. 2025. PMID: 40813674 Free PMC article.
-
Fully Automated Online Adaptive Radiation Therapy Decision-Making for Cervical Cancer Using Artificial Intelligence.Int J Radiat Oncol Biol Phys. 2025 Jul 15;122(4):1012-1021. doi: 10.1016/j.ijrobp.2025.04.012. Epub 2025 Apr 17. Int J Radiat Oncol Biol Phys. 2025. PMID: 40252932
-
[Volume and health outcomes: evidence from systematic reviews and from evaluation of Italian hospital data].Epidemiol Prev. 2013 Mar-Jun;37(2-3 Suppl 2):1-100. Epidemiol Prev. 2013. PMID: 23851286 Italian.
-
A rapid and systematic review of the clinical effectiveness and cost-effectiveness of paclitaxel, docetaxel, gemcitabine and vinorelbine in non-small-cell lung cancer.Health Technol Assess. 2001;5(32):1-195. doi: 10.3310/hta5320. Health Technol Assess. 2001. PMID: 12065068
References
-
- Lim G., Bezjak A., Higgins J., et al. Tumor regression and positional changes in non-small cell lung cancer during radical radiotherapy. J Thorac Oncol. 2011;6:531–536. - PubMed
-
- Finazzi T., Haasbeek C.J.A., Spoelstra F.O.B., et al. Clinical outcomes of stereotactic MR-guided adaptive radiation therapy for high-risk lung tumors. Int J Radiat Oncol Biol Phys. 2020;107:270–278. - PubMed
Grants and funding
LinkOut - more resources
Full Text Sources
