Peanut leaf transcriptomic dynamics reveals insights into the acclimation response to elevated carbon dioxide under semiarid conditions
- PMID: 40213316
- PMCID: PMC11981908
- DOI: 10.3389/fpls.2024.1407574
Peanut leaf transcriptomic dynamics reveals insights into the acclimation response to elevated carbon dioxide under semiarid conditions
Abstract
Introduction: Elevated atmospheric carbon dioxide [CO2] increases peanut carbon assimilation and productivity. However, the molecular basis of such responses is not well understood. We tested the hypothesis that maintaining high photosynthesis under long-term elevated [CO2] is associated with the shift in C metabolism gene expression regulation.
Methods: We used a field CO2 enrichment system to examine the effects of elevated [CO2] (ambient + 250 ppm) across different soil water availability and plant developmental stages on the molecular responses in a peanut runner-type genotype. Plants under both [CO2] treatments were grown in semiarid conditions. We evaluated a comparative leaf transcriptomic profile across three periodic water deficit/re-hydration (well-watered/recovery) cycles throughout the growing season using RNAseq analysis.
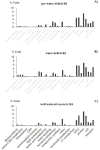
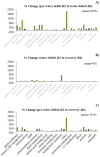
Results: Our results showed that the transcriptome responses were influenced by [CO2], water availability, and developmental stages. The traditional Mercator annotation analysis based on percentage total revealed that lipid metabolism, hormone biosynthesis, secondary metabolism, amino acid biosynthesis, and transport were the most regulated biological processes. However, our new approach based on the comparative relative percentage change per individual category across stages revealed new insights into the gene expression patterns of biological functional groups, highlighting the relevance of the C-related pathways regulated by elevated [CO2].
Discussion: The photosynthesis analysis showed that 1) The light reaction was the most upregulated pathway by elevated [CO2] during water stress, 2) Photorespiration was downregulated across all stages, 3) Sucrose synthesis genes were upregulated by elevated [CO2] before stress, 4) Starch synthesis genes were upregulated by elevated [CO2] under drought periods, and 5) CO2 regulation of sucrose and starch degradation was critical under drought periods. Our findings provide valuable insights into the molecular basis underlying the photosynthetic acclimation response to elevated [CO2] in peanuts.
Keywords: acclimation; drought; gene expression; photorespiration; water stress.
Copyright © 2025 Laza, Bhattarai, Mendu, Burow, Emendack, Sanchez, Gupta, Abdelrahman, Tran, Tissue and Payton.
Conflict of interest statement
Author PP was employed by the company Goanna Ag. Goanna Ag had no role in the design, analysis, or interpretation of this study nor did they provide any funding for this project. The remaining authors declare that the research was conducted in the absence of any commercial or financial relationships that could be construed as a potential conflict of interest. The author(s) declared that they were an editorial board member of Frontiers, at the time of submission. This had no impact on the peer review process and the final decision.
Figures


Similar articles
-
Does long-term cultivation of saplings under elevated CO2 concentration influence their photosynthetic response to temperature?Ann Bot. 2015 Nov;116(6):929-39. doi: 10.1093/aob/mcv043. Epub 2015 Apr 7. Ann Bot. 2015. PMID: 25851132 Free PMC article.
-
Elevated concentrations of soil carbon dioxide with partial root-zone drying enhance drought tolerance and agro-physiological characteristics by regulating the expression of genes related to aquaporin and stress response in cucumber plants.BMC Plant Biol. 2024 Oct 1;24(1):917. doi: 10.1186/s12870-024-05310-2. BMC Plant Biol. 2024. PMID: 39354350 Free PMC article.
-
Future CO2 , warming and water deficit impact white and red Tempranillo grapevine: Photosynthetic acclimation to elevated CO2 and biomass allocation.Physiol Plant. 2021 Jul;172(3):1779-1794. doi: 10.1111/ppl.13388. Epub 2021 Mar 25. Physiol Plant. 2021. PMID: 33704796
-
Photosynthetic acclimation to rising atmospheric carbon dioxide concentration.Indian J Exp Biol. 2000 Oct;38(10):961-6. Indian J Exp Biol. 2000. PMID: 11324166 Review.
-
Plant carbon metabolism and climate change: elevated CO2 and temperature impacts on photosynthesis, photorespiration and respiration.New Phytol. 2019 Jan;221(1):32-49. doi: 10.1111/nph.15283. Epub 2018 Jul 8. New Phytol. 2019. PMID: 29983005 Review.
References
-
- Baker J. T., Gitz D. C., Payton P., Broughton K. J., Bange M. P., Lascano R. J. (2014). Carbon dioxide control in an open system that measures canopy gas exchanges. Agron. J. 106, 789–792. doi: 10.2134/agronj13.0450 - DOI
LinkOut - more resources
Full Text Sources

