

Tunneling Mechanisms of Quinones in Photosynthetic Reaction Center-Light Harvesting 1 Supercomplexes
- PMID: 40213462
- PMCID: PMC11935075
- DOI: 10.1002/smsc.202400188
Tunneling Mechanisms of Quinones in Photosynthetic Reaction Center-Light Harvesting 1 Supercomplexes
Abstract
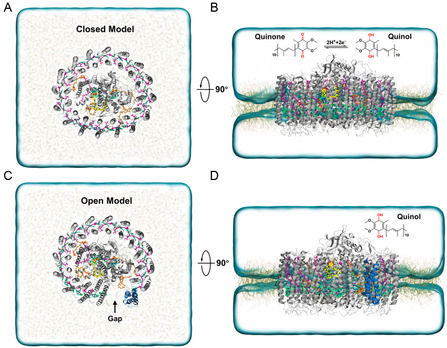
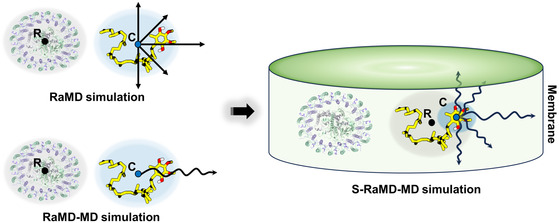
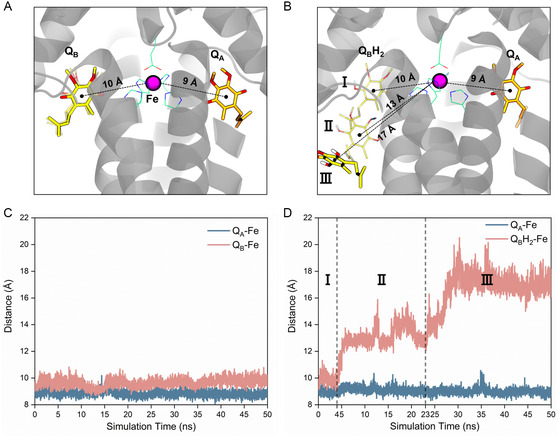
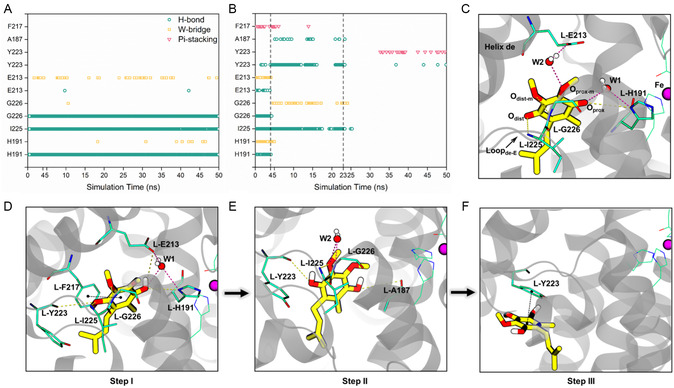
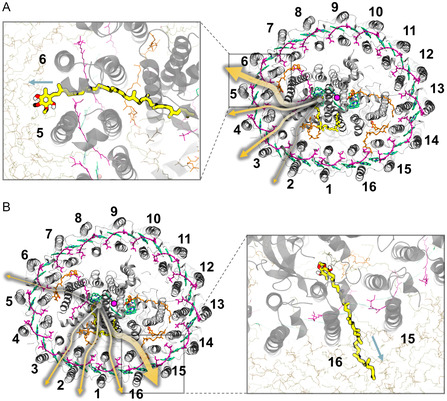
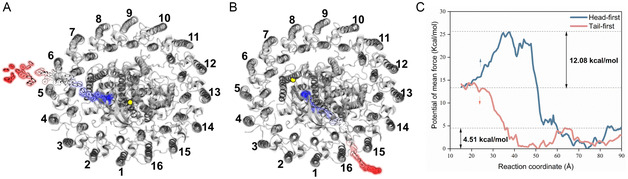
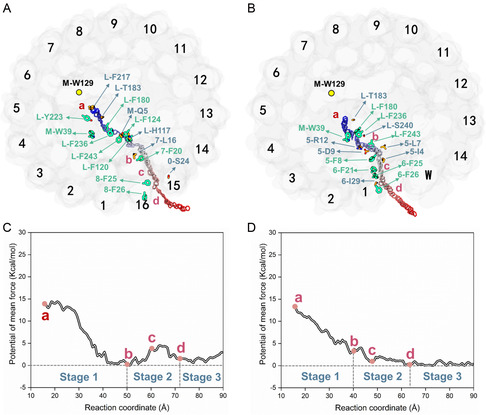
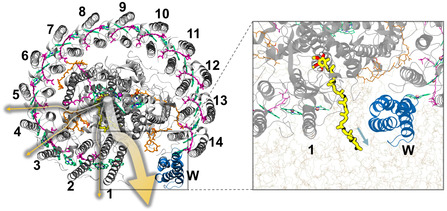
In photosynthesis, light energy is absorbed and transferred to the reaction center, ultimately leading to the reduction of quinone molecules through the electron transfer chain. The oxidation and reduction of quinones generate an electrochemical potential difference used for adenosine triphosphate synthesis. The trafficking of quinone/quinol molecules between electron transport components has been a long-standing question. Here, an atomic-level investigation into the molecular mechanism of quinol dissociation in the photosynthetic reaction center-light-harvesting complex 1 (RC-LH1) supercomplexes from Rhodopseudomonas palustris, using classical molecular dynamics (MD) simulations combined with self-random acceleration MD-MD simulations and umbrella sampling methods, is conducted. Results reveal a significant increase in the mobility of quinone molecules upon reduction within RC-LH1, which is accompanied by conformational modifications in the local protein environment. Quinol molecules have a tendency to escape from RC-LH1 in a tail-first mode, exhibiting channel selectivity, with distinct preferred dissociation pathways in the closed and open LH1 rings. Furthermore, comparative analysis of free energy profiles indicates that alternations in the protein environment accelerate the dissociation of quinol molecules through the open LH1 ring. In particular, aromatic amino acids form π-stacking interactions with the quinol headgroup, resembling the key components in a conveyor belt system. This study provides insights into the molecular mechanisms that govern quinone/quinol exchange in bacterial photosynthesis and lays the framework for tuning electron flow and energy conversion to improve metabolic performance.
Keywords: electron transport; enhanced sampling; molecular dynamics simulations; photosynthesis; quinone/quinol.
© 2024 The Author(s). Small Science published by Wiley‐VCH GmbH.
Conflict of interest statement
The authors declare no conflict of interest.
Figures
Similar articles
-
Structures of Rhodopseudomonas palustris RC-LH1 complexes with open or closed quinone channels.Sci Adv. 2021 Jan 13;7(3):eabe2631. doi: 10.1126/sciadv.abe2631. Print 2021 Jan. Sci Adv. 2021. PMID: 33523887 Free PMC article.
-
Structural basis for the assembly and quinone transport mechanisms of the dimeric photosynthetic RC-LH1 supercomplex.Nat Commun. 2022 Apr 13;13(1):1977. doi: 10.1038/s41467-022-29563-3. Nat Commun. 2022. PMID: 35418573 Free PMC article.
-
Architectures of photosynthetic RC-LH1 supercomplexes from Rhodobacter blasticus.Sci Adv. 2024 Oct 11;10(41):eadp6678. doi: 10.1126/sciadv.adp6678. Epub 2024 Oct 9. Sci Adv. 2024. PMID: 39383221 Free PMC article.
-
Novel features of LH1-RC from Thermochromatium tepidum revealed from its atomic resolution structure.FEBS J. 2018 Dec;285(23):4359-4366. doi: 10.1111/febs.14679. Epub 2018 Oct 30. FEBS J. 2018. PMID: 30328658 Review.
-
A comparative look at structural variation among RC-LH1 'Core' complexes present in anoxygenic phototrophic bacteria.Photosynth Res. 2020 Aug;145(2):83-96. doi: 10.1007/s11120-020-00758-3. Epub 2020 May 19. Photosynth Res. 2020. PMID: 32430765 Free PMC article. Review.
Cited by
-
Characterization of the Structure and Function of the Photosynthetic RC-LH1 Core Supercomplex From Rhodospirillum rubrum.Physiol Plant. 2025 May-Jun;177(3):e70275. doi: 10.1111/ppl.70275. Physiol Plant. 2025. PMID: 40384483 Free PMC article.
References
LinkOut - more resources
Full Text Sources
Research Materials
Miscellaneous