. 2025 Mar 3;15(9):3797-3820.
doi: 10.7150/thno.105867. eCollection 2025.

A " CPApoptosis " nano-actuator switches immune-off solid tumors to immune-on for fueling T-cell- based immunotherapy

Affiliations

A " CPApoptosis " nano-actuator switches immune-off solid tumors to immune-on for fueling T-cell- based immunotherapy

Ying Luo et al. Theranostics. .

Abstract

Background: Most anticancer agents induce tumor apoptosis, but they often lack immunogenicity and display limited success when combined with mainstream immunotherapies, thus killing cancer cells through multiple cell death modalities as well as switching immune-off tumors to immune-on is a strategy with great promise. To this end, we developed a CPApoptosis (cuproptosis, pyroptosis, apoptosis) nano-actuator for immunologically cold solid tumors. Methods: In this study, elesclomol (ES), a mitochondrial targeting copper transporter, was encapsulated within bacterial outer membrane vesicles (OMVs). These OMVs were then surface-modified via metal-phenolic self-assembly using Cu2+ and tannic acid (TA). Results: The Cu2+ and ES were released from the OMVs in a pH-dependent manner. OMV activated the non-canonical pyroptotic pathway, leading to cell membrane rupture. Cu2+ on the one hand was transported to the mitochondria for cuproptosis facilitated by ES, on the other hand, Cu2+ was reduced into Cu+ by TA, which catalyzed ROS production to induce oxidative apoptosis. Simultaneously, TA degraded glutathione (GSH), sensitizing cells to cuproptosis. The multifactorial cell death mechanisms led to the release of immunogenic factors from lysed tumor cells, stimulating dendritic cell maturation and recruiting cytotoxic T cells. This immune response was further amplified by αPD-L1 antibody treatment. Conclusion: The CPApoptosis nano-actuator represents a promising approach to enhance current cancer therapies, inducing both tumor cell death and a robust immune response, with the potential for long-lasting protective effects.

Keywords: apoptosis; bacterial outer membrane vesicle; cuproptosis; immunogenic cell death; pyroptosis.


Conflict of interest statement

Competing Interests: The authors have declared that no competing interest exists.

Figures

Scheme 1
Scheme 1
(A) The synthetic process of the OCT@ES. (B) The illustrative mechanism of OCT@ES-induced ternary cell death modalities (cuproptosis, pyroptosis, and apoptosis) accompanied by antitumor immune activation locally and systematically for long-term protection.
Figure 1
Figure 1
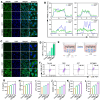
Characterization, cytotoxicity, intracellular uptake of OCT@ES. (A) TEM of OMV, OCT@ES, and elemental mapping of OCT@ES. Scale bar for OMV and OCT@ES: 200 nm, Scale bar for the magnified OMV and OCT@ES: 100 nm. (B) SDS-PAGE assay of OMV and OCT@ES. (C) DLS of OMV, OES, OCT, and OCT@ES. (D) Zeta potential of OMV, ES, OES, OCT, and OCT@ES. Data are shown as the mean values ± SD (n = 3). (E) XPS survey spectra and (F) XPS spectra of Cu2p. (G) The GPX-like activity of OCT@ES. (H) The accumulative Cu release in PBS with pH 5.0, pH 6.5, and pH 7.4. (I) The accumulative ES release in PBS with pH 5.0, pH 6.5, pH 7.4. (J) Cytotoxicity of OMV, OCT, and OCT@ES on HUVEC, hepa1-6 cells, and CT26 cells, respectively. Data are shown as the mean values ± SD (n = 5). (K) Intracellular uptake of DiI-labeled OCT@ES under CLSM. Scale bar: 50 μm. (L) The process of intracellular uptake of OCT@ES under Bio-TEM. Scale bar: 1 μm. All the statistical significance was analyzed by ANOVA, ∗∗∗∗ p < 0.0001, compared with the control group.
Figure 2
Figure 2
The mechanistic study of CPApoptosis. (A) Live/dead cells staining of hepa1-6 cells after treatments with PBS, OMV, OCT, and OCT@ES, respectively under a FL microscope. Scale bar: 100 μm. (B, C) Apoptotic assay of hepa1-6 cells under FCM after various treatments and corresponding quantitative analysis. Data are shown as the mean values ± SD (n = 3). (D) CLSM of mitochondrial potential change in different treatment groups. Scale bar: 25 μm. (E) CLSM of DCFH-DA expression in different treatment groups. Scale bar: 100 μm. (F) Bright field of cell morphology in different treatment groups under a microscope. Scale bar: 100 μm. (G) WB analysis of caspase 11 and GSDMD expression in the non-canonical pyroptosis signaling pathway in different treatment groups. (H) CLSM of DLAT and LIAS expression in different treatment groups. Scale bar: 50 μm. (I) WB analysis of DLAT, FDX1, and LIAS expression in different treatment groups. (J) Bio-TEM images of hepa1-6 cells in the control and OCT@ES groups. Scale bar for the left Bio-TEM: 2 μm, Scale bar for the right enlarged bio-TEM: 1μm.
Figure 3
Figure 3
The evaluation of ICD induction and DC maturation. (A) CLSM of the HMGB1 expression and (B) the FL co-localization of DAPI and HMGB1. Scale bar: 50 μm. (C) CLSM of the CRT expression and (D) the FL quantitative analysis of CRT. Data are shown as the mean values ± SD (n = 3). Scale bar: 50 μm. (E) The schematic illustration of hepa1-6 cell and JAWSII cells on a coculture system. (F) The FCM analysis of DC maturation. (G, H, I, J, K, L) The ELISA assay of IL-1β, LDH, ATP, HMGB1, TNF-α, and IL-6. Data are shown as the mean values ± SD (n = 3). All the statistical significance was analyzed by ANOVA, ∗∗ p < 0.01, ∗∗∗ p < 0.001, ∗∗∗∗ p < 0.0001, compared with the control group.
Figure 4
Figure 4
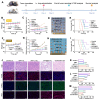
Evaluation of antitumor effect in vivo. (A) The schematic illustration of the therapeutic paradigm on hepa1-6 mouse model and CT26 mouse model. (B) Average body weight change of hepa1-6 mouse model during the observation duration. Data are shown as the mean values ± SD (n = 5). (C) The relative tumor growth curve of the hepa1-6 mouse model in different treatment groups. Data are shown as the mean values ± SD (n = 5). (D) The digital photograph of tumors extracted from the hepa1-6 mouse models at sacrifice on the 14st day. (E) The long-term survival observation in the hepa1-6 mouse models with different treatment. Data are shown as the mean values ± SD (n = 5). (F) Average body weight change of CT26 mouse model during the observation duration. Data are shown as the mean values ± SD (n = 5). (G) The relative tumor growth curve of the CT26 mouse model in different treatment groups. Data are shown as the mean values ± SD (n = 5). (H) The digital photograph of tumors extracted from the CT26 mouse models at sacrifice on the 14st day. (I) The long-term survival observation in the CT26 mouse models with different treatment. Data are shown as the mean values ± SD (n = 5). (J) The representative H&E, PCNA, TUNEL, and DHE staining of tumor slices after different treatments. Scale bar: 50 μm. (K, L, M) The quantitative FL analysis of PCNA, TUNEL, and DHE. Data are shown as the mean values ± SD (n = 3). All the statistical significance was analyzed by ANOVA, ∗∗∗∗ p < 0.0001, compared with the control group.
Figure 5
Figure 5
The mechanistic study of CPApoptosis in vivo. (A) IF staining of GSDMD, DLAT, FDX1, and LIAS in tumor sections after various treatments. Scale bar: 50 μm. (B) IF staining of HMGB1 and (C) CRT in tumor sections after various treatments. Scale bar: 50 μm. (D, E, F, G, H, I) Quantitative FL analysis of GSDMD, DLAT, FDX1, LIAS, HMGB1, and CRT. Data are shown as the mean values ± SD (n = 3). All the statistical significance was analyzed by ANOVA, ∗∗ p < 0.01, ∗∗∗ p < 0.001, ∗∗∗∗ p < 0.0001, ns, not significant, compared with the control group.
Figure 6
Figure 6
The evaluation of tumor immune microenvironment. (A) Representative FCM results of matured DCs (CD11c+CD80+CD86+) within spleens, TDLNs, and tumors after different treatments. (B) Representative FCM results of CTL (CD3+CD8+) within spleens, TDLNs, and tumors after different treatments. (C) Representative FCM results of Treg (CD3+CD4+FOXP3+) within the TDLNs, and tumors after different treatments. (D) IF staining of FOXP3 in tumor sections after different treatments. Scale bar: 50 μm. (E) Representative FCM results of T-cell subtypes (CD8+IFNγ+, CD8+granzymeB+, CD8+TNFα+, CD8+perforin+, CD8+PD1+) within the tumors after different treatments. (F) IF staining of granzyme B and GSDME in tumor sections after different treatments. Scale bar: 50 μm.
Figure 7
Figure 7
The long-term protective effect on tumor rechallenged models and lung metastasis models. (A) The schematic illustration of the establishment of tumor rechallenged models. (B) The average body weight change of the tumor rechallenged models after different treatments. Data are shown as the mean values ± SD (n = 5). (C) The tumor volume change of the tumor rechallenged models after different treatments. Data are shown as the mean values ± SD (n = 5). (D) The digital photograph of tumors extracted from the tumor rechallenged models at sacrifice on the 48th day. (E) The weight of tumors extracted from the tumor rechallenged models at sacrifice on the 48th day. Data are shown as the mean values ± SD (n = 5). (F) Representative FCM results of Tem (CD3+CD8+CD44+CD62L+) within spleens, TDLNs, and tumors after different treatments. (G, H, I) Quantitative analysis of Tem in spleens, TDLNs, or tumors, respectively. Data are shown as the mean values ± SD (n = 3). (J) The schematic illustration of the establishment of lung metastasis models. (K) The digital photos and H&E staining of lung tissues immersed by Bouin's fixative solution after different treatments. Scale bar: 2.5 mm. All the statistical significance was analyzed by ANOVA, ∗∗ p < 0.01, ∗∗∗ p < 0.001, ∗∗∗∗ p < 0.0001, compared with the control group.

Similar articles

Cited by

References

    1. Meier P, Legrand AJ, Adam D, Silke J. Immunogenic cell death in cancer: targeting necroptosis to induce antitumour immunity. Nat Rev Cancer. 2024;24:299–315. - PubMed
    1. Kroemer G, Galassi C, Zitvogel L, Galluzzi L. Immunogenic cell stress and death. Nat Immunol. 2022;23:487–500. - PubMed
    1. Pfeffer CM, Singh ATK. Apoptosis: A Target for Anticancer Therapy. Int J Mol Sci. 2018;19:448. - PMC - PubMed
    1. Wang Q, Ju X, Wang J, Fan Y, Ren M, Zhang H. Immunogenic cell death in anticancer chemotherapy and its impact on clinical studies. Cancer Lett. 2018;438:17–23. - PubMed
    1. Tong X, Tang R, Xiao M, Xu J, Wang W, Zhang B. et al. Targeting cell death pathways for cancer therapy: recent developments in necroptosis, pyroptosis, ferroptosis, and cuproptosis research. J Hematol Oncol. 2022;15:174. - PMC - PubMed