. 2025 Mar 10;15(9):4033-4053.
doi: 10.7150/thno.109771. eCollection 2025.

Hepatic stellate cell-derived microfibrillar-associated protein 2 prevents liver fibrosis by regulating extracellular matrix and inflammation

Affiliations

Hepatic stellate cell-derived microfibrillar-associated protein 2 prevents liver fibrosis by regulating extracellular matrix and inflammation

Wen Zhang et al. Theranostics. .

Abstract

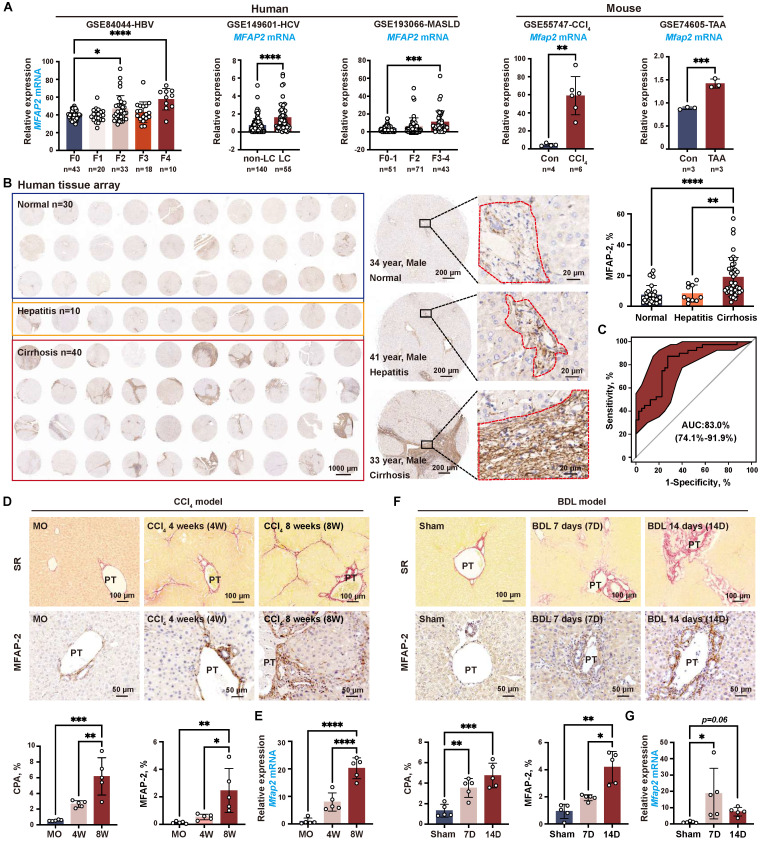
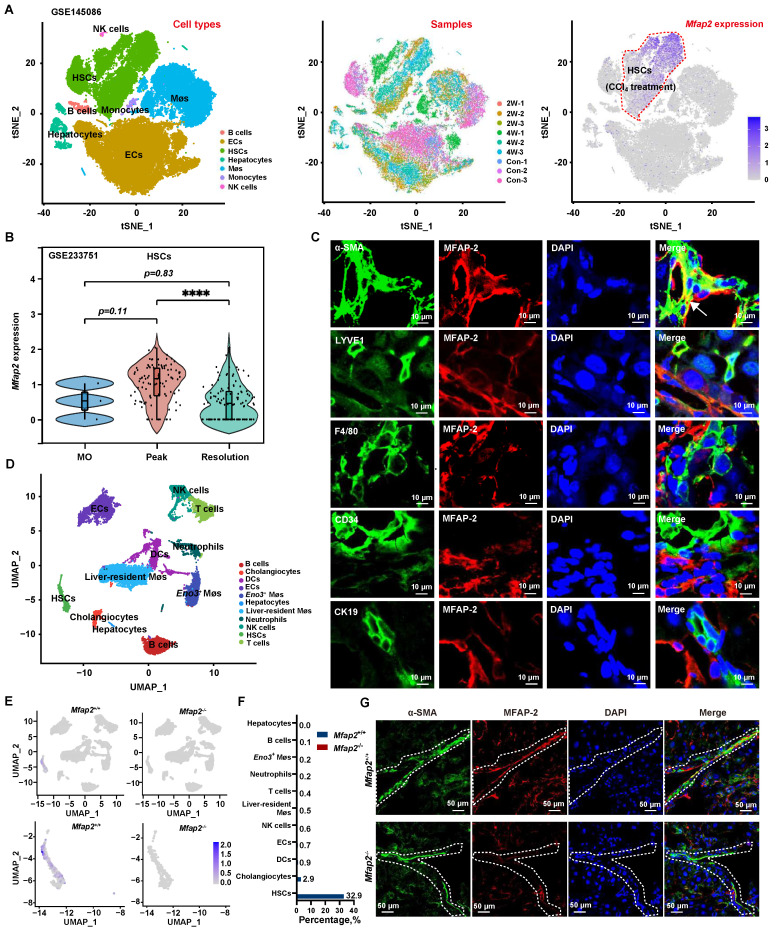
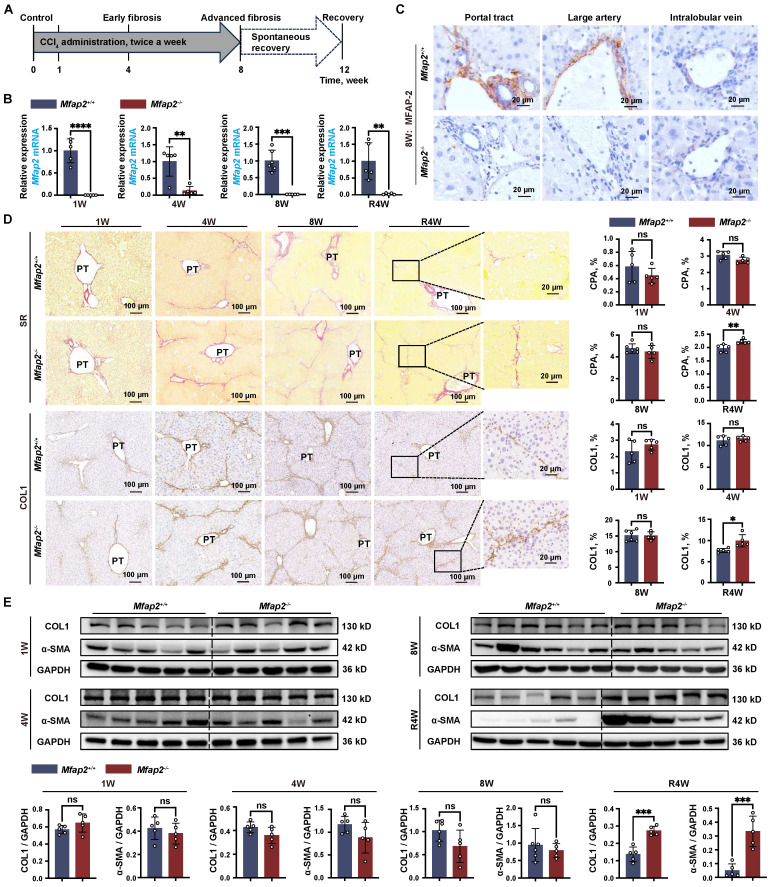
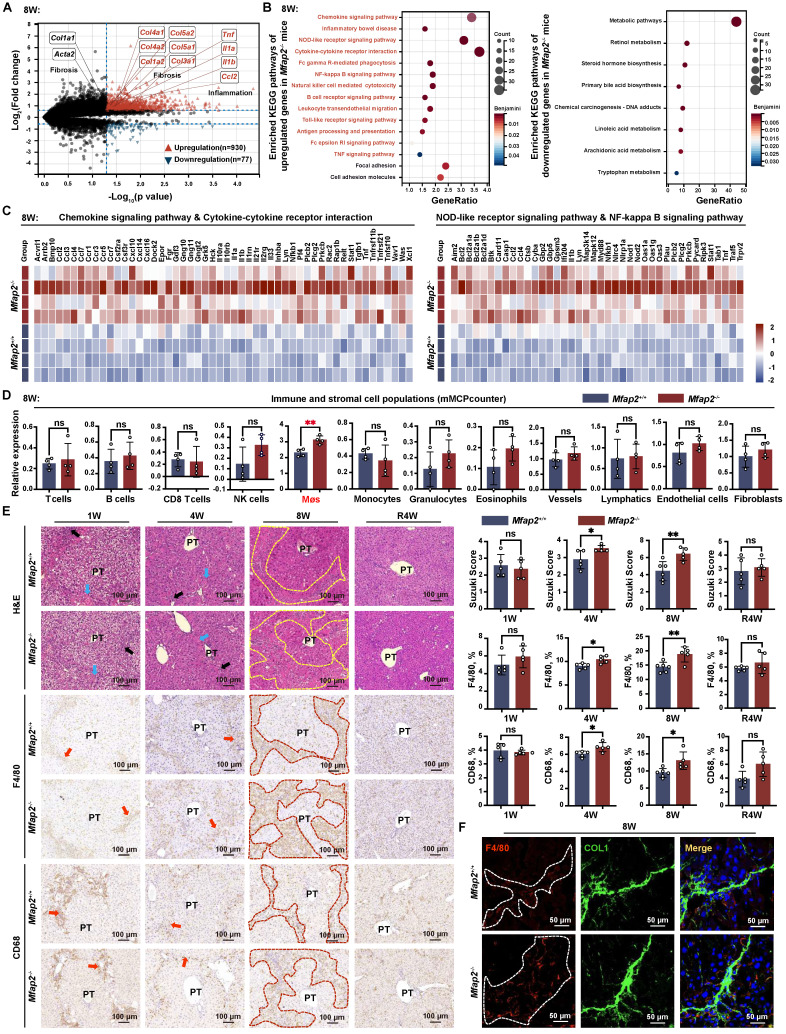
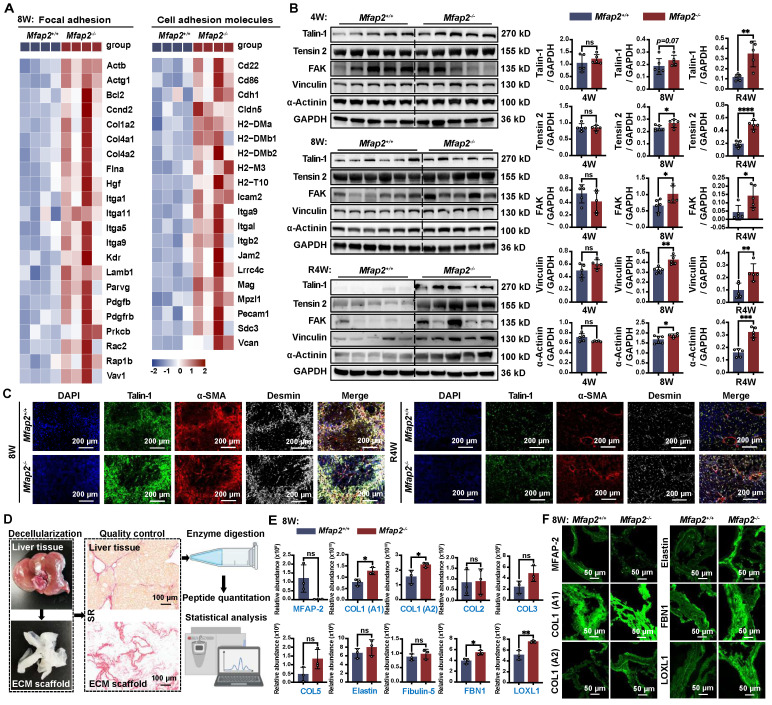
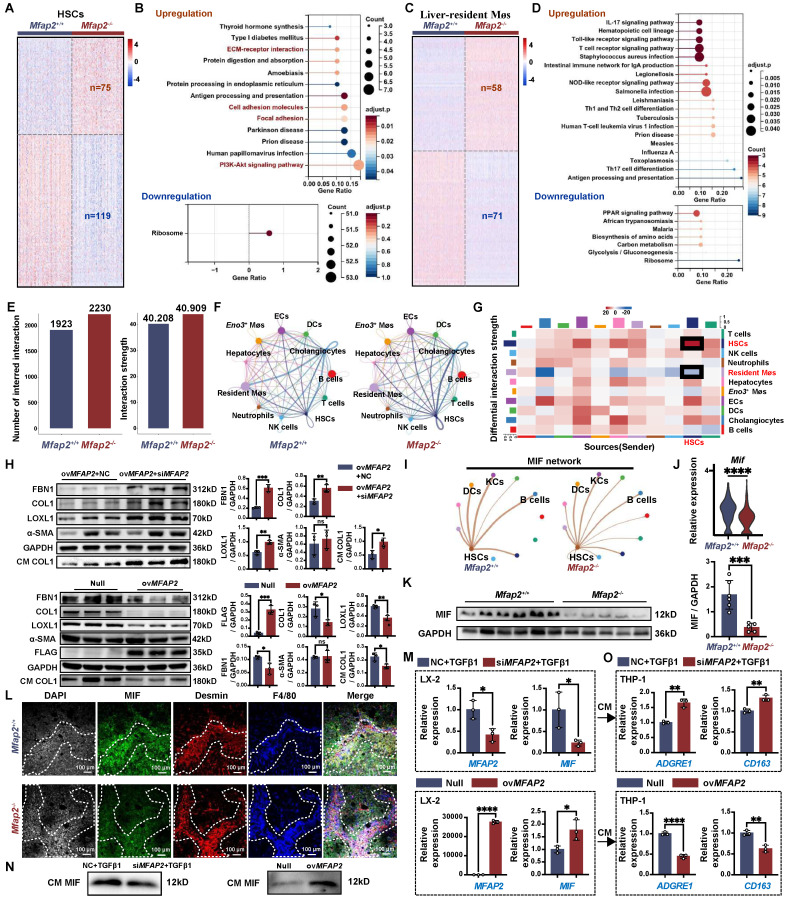
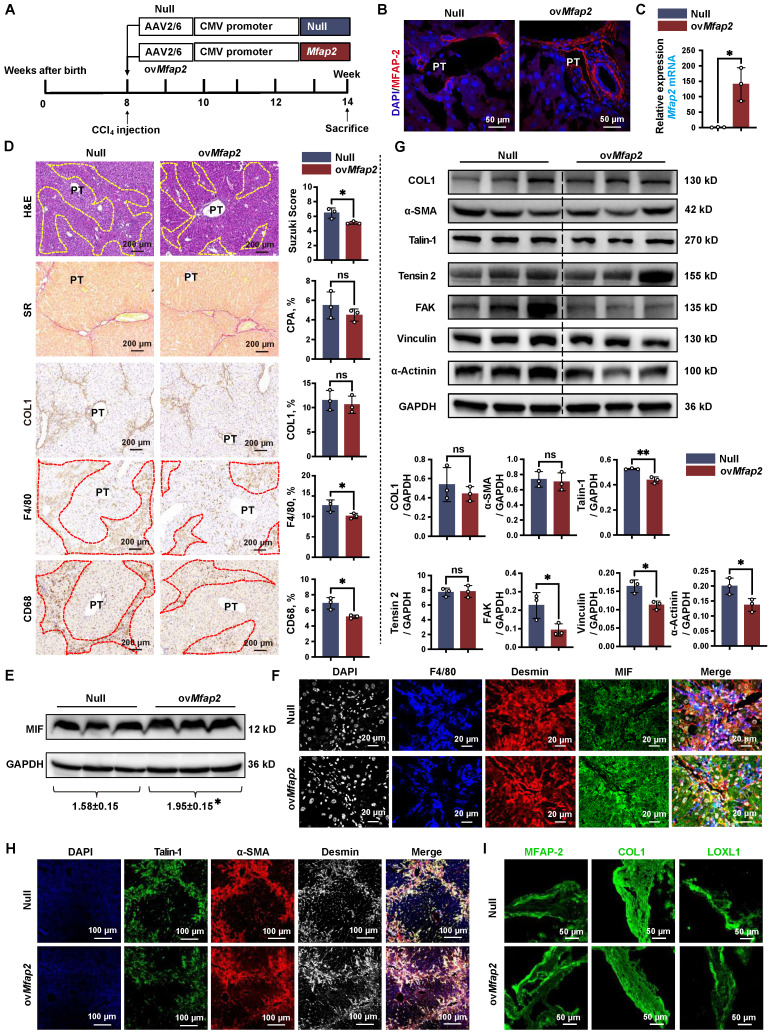
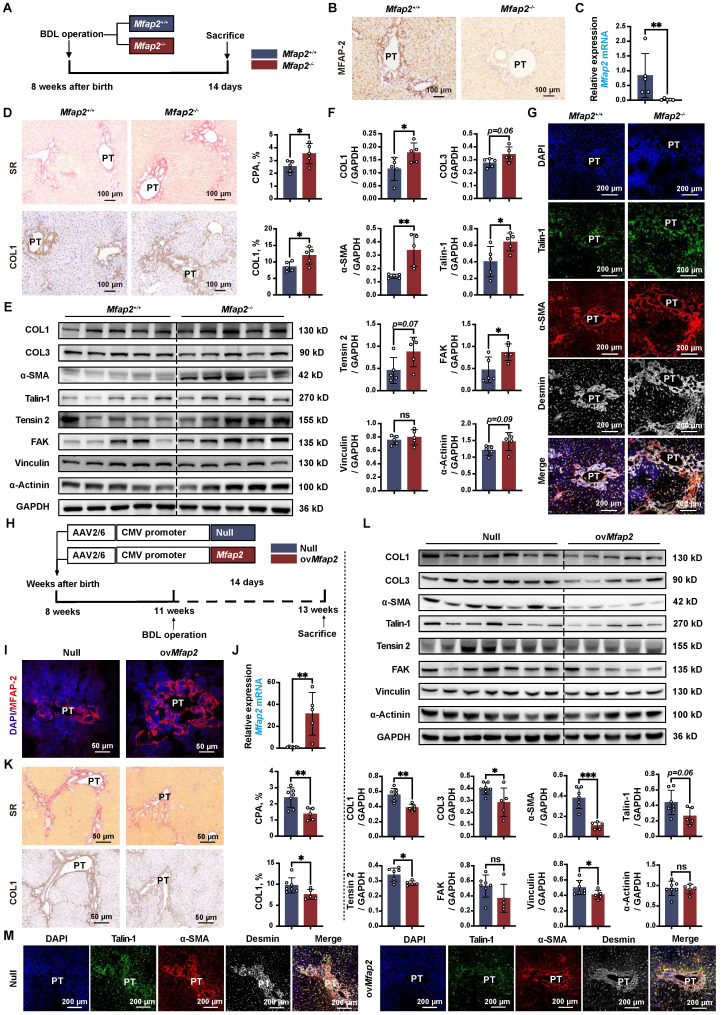
Microfibrillar-associated protein 2 (MFAP-2) is a crucial component of the extracellular matrix (ECM) microfibrils, yet its role in liver fibrosis remains elusive. Methods: Human tissue arrays and mouse models of fibrosis progression and resolution were used to investigate MFAP-2 expression patterns. Mfap2 deficiency (Mfap2 -/-) or overexpression (ovMfap2) mice were subjected to carbon tetrachloride (CCl4) injection or bile duct ligation (BDL) to induce liver fibrosis. Histological, biochemical, bulk, or single-cell RNA-sequencing (scRNA-seq), proteomics to analyze the matrisome, and in vitro studies were conducted. Results: MFAP-2 was predominantly enriched in activated hepatic stellate cells (HSCs) and upregulated in advanced liver fibrosis. Although Mfap2 ablation had minimal impact on collagen deposition during CCl4 injection, it significantly delayed fibrosis regression after CCl4 cessation. The delayed fibrosis regression due to Mfap2 deficiency was likely linked to aggravated intrahepatic inflammation, ECM stabilization, and activated focal adhesion signaling in HSCs. Mechanically, inhibiting HSC-derived Mfap2 enhanced HSC interactions and increased matrisome protein production, while reducing the interaction between HSCs and liver-resident macrophages by decreasing macrophage migration inhibitory factor secretion from HSCs. Additionally, we validated the role of Mfap2 deletion in liver fibrosis using the BDL mouse model, demonstrating a more pronounced effect on fibrosis progression. Adeno-associated virus vector (serotype 6)-mediated Mfap2 overexpression in HSCs conferred protection against liver fibrosis in both models. Conclusion: This study reveals the compensatory protective effects of HSC-derived MFAP-2 on liver fibrosis and its underlying mechanisms. Enhancing MFAP-2 in HSCs may therefore benefit patients with liver fibrosis.

Keywords: Liver fibrosis; extracellular matrix; hepatic stellate cell; macrophage; matrisome.


Conflict of interest statement

Competing Interests: The authors have declared that no competing interest exists.

Figures

Figure 1
Figure 1
MFAP-2 is elevated in fibrotic livers from humans and mice. (A) Analysis of MFAP2/Mfap2 gene expression using publicly available datasets. The sample size for each group is indicated below the respective bar. (B) IHC and quantification of MFAP-2 expression in normal (n = 30), hepatitis (n = 10), and cirrhosis (n = 40) livers from a human tissue array. (C) ROC analysis based on MFAP-2 expression in liver slices from the human tissue array. (D-G) Sirius Red staining, IHC, and qPCR analyses of MFAP-2 (Mfap2) expression in liver tissues from CCl4 and BDL mouse models (n = 5/group). Data are expressed as mean ± SEM. *p < 0.05, **p < 0.01, ***p < 0.001, and ****p < 0.0001. CPA: collagen proportional area; LC: liver cirrhosis; MO: mineral oil; non-LC: non-liver cirrhosis; PT: portal tract; SR: Sirius Red staining; TAA: thioacetamide.
Figure 2
Figure 2
MFAP-2 is enriched and increased in activated HSCs. (A) scRNA-seq analysis of Mfap2 gene expression in CCl4-injected mouse livers, using the publicly available dataset GSE145086. The t-SNE plots, displayed from left to right, show cell types, samples (Con: control; 2W: two weeks; 4W: four weeks), and Mfap2 gene expression. (B) Comparison of Mfap2 gene expression in HSCs from control (MO), peak liver fibrosis, and fibrosis regression in mice, based on our published scRNA-seq data (GSE233751). (C) Immunofluorescent staining of α-SMA (green), LYVE1 (green), F4/80 (green), CD34 (green), CK19 (green), MFAP-2 (red), and DAPI (nucleus, blue) in liver tissues from CCl4-injected mice. Co-localization is indicated in yellow. (D-F) UMAP plots showing eleven annotated cell types along with Mfap2 gene expression, and a comparison of the proportion of Mfap2+ liver cells. (G) Immunofluorescent staining of MFAP-2 (red), α-SMA (green), and DAPI (nucleus, blue) in liver tissues from Mfap2+/+ and Mfap2-/- mice, with co-localization shown in yellow. Data are expressed as mean ± SEM. ****p < 0.0001.
Figure 3
Figure 3
Mfap2-/- mice show slower fibrosis regression after CCl4 cessation. Mfap2-/- and Mfap2+/+ mice were injected with CCl4 for one (1W), four (4W), or eight (8W) weeks, followed by a cessation period of four weeks (R4W). (A) Schematic diagram illustrating the model of CCl4-induced liver fibrosis and subsequent resolution. (B) qPCR analysis of Mfap2 gene expression (n = 5-6/group). (C) IHC analysis of MFAP-2 expression. (D) Sirius Red staining of liver sections and IHC analysis of COL1 expression (n = 5-6/group). (E) Immunoblotting analysis of COL1 and α-SMA expression (n = 5-6/group). Data are expressed as mean ± SEM. *p < 0.05, **p < 0.01, ***p < 0.001, and ****p < 0.0001. ns: not significant; PT: portal tract.
Figure 4
Figure 4
Mfap2-/- mice exhibit increased intrahepatic inflammation. Mfap2-/- and Mfap2+/+ mice were injected with CCl4 for one (1W), four (4W), or eight (8W) weeks, followed by a cessation period of four weeks (R4W). (A) Volcano plot illustrating differentially expressed genes (n = 4/group; p < 0.05 & FC>1.5). (B) Significantly enriched KEGG pathways based on upregulated or downregulated genes (Benjamini-corrected p < 0.05). (C) Heatmaps displaying gene expression in representative immune-related KEGG pathways. (D) Comparisons of liver immune and stromal cell populations (n = 4/group). (E) H&E staining of liver slices and IHC analysis of F4/80 or CD68 expression (n = 5-6/group). (F) Immunofluorescent staining of COL1 (green), F4/80 (red), and DAPI (nucleus, blue). Data are expressed as mean ± SEM. *p < 0.05, **p < 0.01. ns: not significant; PT: portal tract.
Figure 5
Figure 5
Mfap2 deletion activates FA signaling in HSCs and stabilizes the ECM following CCl4 injection. Mfap2-/- and Mfap2+/+ mice were injected with CCl4 for four (4W) or eight (8W) weeks, followed by a cessation period of four weeks (R4W). (A) Heatmaps displaying gene expression of molecules involved in FA and cell adhesion signaling. (B) Immunoblotting analysis of FA signaling markers (n = 5-6/group). (C) Multiplex IF staining of Talin-1 (green), α-SMA (red), Desmin (grey), and DAPI (nucleus, blue). Co-localization of Talin-1 and α-SMA is indicated in yellow. (D) Workflow for liver decellularization, proteolytic digestion, and quantification by MS. (E) Comparisons of insoluble collagens and elastic fiber assembly-related ECM components in the decellularized ECM scaffolds (n = 3/group). (F) Immunofluorescent staining of MFAP-2, COL1 (A1), COL1 (A2), Elastin, FBN1, and LOXL1 in decellularized ECM scaffolds. Data are expressed as mean ± SEM. *p < 0.05, **p < 0.01, ***p < 0.001, ****p < 0.0001. ns: not significant.
Figure 6
Figure 6
Mfap2 deletion aggravates CCl4-induced liver fibrosis by stabilizing the ECM and facilitating intrahepatic inflammation. Mfap2-/- and Mfap2+/+ mice were injected with CCl4 for eight weeks. (A, C) Heatmaps showing the expression of differentially expressed genes in HSCs or liver-resident Møs. (B, D) Significantly enriched KEGG pathways based on the upregulated or downregulated genes in HSCs or liver-resident Møs (adjusted p < 0.05). (E) Number of inferred cellular interactions and their strength. (F) Circle plots showing the cellular interactions, with edge width proportional to the number of interactions. (G) Heatmap depicting differential interaction strength (decrease, blue; increase, red). The top vertical bar represents incoming signaling, while the left horizontal bar refers to outgoing signaling. (H) Immunoblotting analysis of FBN1, COL1, LOXL1, α-SMA, and FLAG in HSC cell lines treated with ovMfap2 (2.0 μg/mL, 48 hours) + NC (50 nM, 36 hours), ovMfap2 (2.0 μg/mL, 48 hours) + siMfap2 (50 nM, 36 hours), Null (2.0 μg/mL, 48 hours), or ovMfap2 (2.0 μg/mL, 48 hours) (n = 3/group). (I) Circle plots showing the interaction strength of the MIF signal from HSCs to other cells. (J) Violin plot depicting the expression level of Mif in HSCs based on scRNA-seq data. (K) Immunoblotting analysis of MIF protein levels (n = 5-6/group). (L) Multiplex IF staining of MIF (green), Desmin (red), F4/80 (blue), and DAPI (nucleus, grey). Co-localization of Desmin and MIF is indicated in yellow. (M) qPCR analysis of MFAP2 and MIF gene expression in HSCs treated with siMFAP2 (50 nM, 36 hours) + TGFβ1 (10 ng/mL, 48 hours) or ovMFAP2 (2.0 μg/mL, 48 hours) (n = 3/group). (N) Immunoblotting analysis of MIF levels in the CM from cell groups in (M) (n = 3/group). (O) qPCR analysis of ADGRE1 and CD163 gene expression in THP-1 cells treated with the CM from (M) for 36 hours (n = 3/group). Data are expressed as mean ± SEM. *p < 0.05, **p < 0.01, ***p < 0.001, ****p < 0.0001. ns: not significant; CM: conditioned media; NC: negative control.
Figure 7
Figure 7
OvMfap2 prevents intrahepatic inflammation and ECM remodeling. OvMfap2 and control (Null) mice were injected with CCl4 for six weeks. (A) Schematic diagram illustrating the model of CCl4-induced liver fibrosis in ovMfap2 and Null mice. (B) Immunofluorescent staining of MFAP-2. (C) qPCR of Mfap2 gene expression (n = 3/group). (D) H&E staining, Sirius Red staining, IHC analysis of COL1, F4/80, and CD68 (n = 3/group). (E) Immunoblotting analysis of MIF levels after ovMFAP2 in LX-2 cells (n = 3/group). (F) Multiplex IF staining of MIF (Green), Desmin (red), F4/80 (blue), and DAPI (nucleus, grey). Co-localization of MIF and Desmin is shown in yellow. (G) Immunoblotting analysis of COL1, α-SMA, FA signaling markers after ovMFAP2 in LX-2 cells (n = 3/group). (H) Multiplex IF staining of Talin-1 (Green), α-SMA (red), Desmin (grey), and DAPI (nucleus, blue). Co-localization of Talin-1 and α-SMA is shown in yellow. (I) Immunofluorescent staining of COL1 (green) or LOXL1 (green) in decellularized ECM scaffolds. Data are expressed as mean ± SEM. *p < 0.05, **p < 0.01. ns: not significant.
Figure 8
Figure 8
Mfap2-/- aggravates, while ovMfap2 attenuates liver fibrosis in the BDL mouse model. Mfap2-/-, Mfap2+/+, Null, or ovMfap2 mice underwent BDL for fourteen days. (A) Schematic diagram illustrating BDL-induced liver fibrosis in Mfap2+/+ and Mfap2-/- mice. (B, C) IHC and qPCR analyses of MFAP-2 (Mfap2) (n = 5/group). (D) Sirius Red staining and IHC analysis of COL1 (n = 5/group). (E, F) Immunoblotting analysis of COL1, COL3, α-SMA, and FA signaling markers (n = 5/group). (G) Multiplex IF staining of Talin-1 (green), α-SMA (red), Desmin (grey), and DAPI (nucleus, blue). Co-localization of Talin-1 and α-SMA is indicated in yellow. (H) Schematic diagram illustrating BDL-induced liver fibrosis in Null and ovMfap2 mice. (I, J) Immunofluorescent staining of MFAP-2 (red) and qPCR analysis of Mfap2 (n = 5-7/group). (K) Sirius Red staining and IHC analysis of COL1 (n = 5-7/group). (L) Immunoblotting analysis of COL1, COL3, α-SMA, and FA signaling markers (n = 5-7/group). (M) Multiple IF staining of Talin-1 (green), α-SMA (red), Desmin (grey), and DAPI (nucleus, blue). Co-localization of Talin-1 and α-SMA is shown in yellow. Data are expressed as mean ± SEM. *p < 0.05, **p < 0.01, ***p < 0.001. ns: not significant.

Similar articles

References

    1. John BV, Dang Y, Kaplan DE, Jou JH, Taddei TH, Spector SA. et al. Liver Stiffness Measurement and Risk Prediction of Hepatocellular Carcinoma After HCV Eradication in Veterans With Cirrhosis. Clin Gastroenterol Hepatol. 2024;22:778–88. e7. - PMC - PubMed
    1. Fan W, Adebowale K, Vancza L, Li Y, Rabbi MF, Kunimoto K. et al. Matrix viscoelasticity promotes liver cancer progression in the pre-cirrhotic liver. Nature. 2024;626:635–42. - PMC - PubMed
    1. Sun Y, Chen W, Chen S, Wu X, Zhang X, Zhang L. et al. Regression of Liver Fibrosis in Patients on Hepatitis B Therapy Is Associated With Decreased Liver-Related Events. Clin Gastroenterol Hepatol. 2024;22:591–601. e3. - PubMed
    1. Chang X, Lv C, Wang B, Wang J, Song Z, An L. et al. The utility of P-I-R classification in predicting the on-treatment histological and clinical outcomes of patients with hepatitis B and advanced liver fibrosis. Hepatology. 2024;79:425–37. - PMC - PubMed
    1. Sun Y, Zhou J, Wang L, Wu X, Chen Y, Piao H. et al. New classification of liver biopsy assessment for fibrosis in chronic hepatitis B patients before and after treatment. Hepatology. 2017;65:1438–50. - PubMed

Substances