. 2025 Mar 10;15(9):4074-4083.
doi: 10.7150/thno.105427. eCollection 2025.

Transcranial ultrasound localization microscopy in moyamoya patients using a clinical ultrasound system

Affiliations

Transcranial ultrasound localization microscopy in moyamoya patients using a clinical ultrasound system

Louise Denis et al. Theranostics. .

Abstract

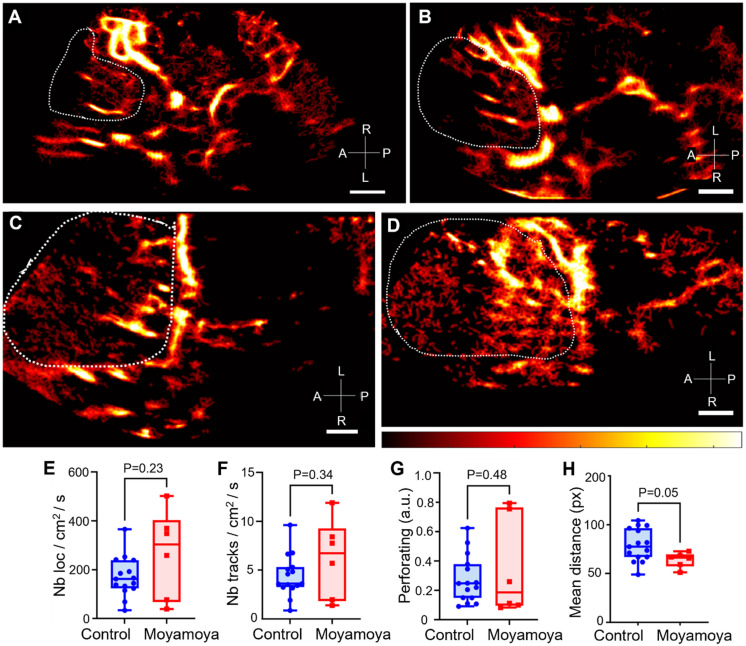
Background: Deep brain structures are supplied by perforating arteries, which are too thin to be observed with non-invasive and widely available clinical imaging methods. In moyamoya disease, main arteries in the base of the brain progressively narrow, and perforating arteries grow densely and tortuously to compensate the lack of blood supply in deep brain structures. Purpose: The aim of this study is to evaluate the efficacy of transcranial ultrasound localization microscopy (ULM) in visualizing perforating arteries, utilizing a standard low-frame-rate ultrasound clinical scanner and contrast sequences commonly employed in hospital settings. Methods: This prospective single-center study included ischemic stroke patients not related to the study of perforating arteries, and moyamoya disease patients. Contrast-enhanced ultrasound sequences (CEUS) were performed by an experienced neurologist and the images acquired were used to perform post-processing ULM. ULM density maps were compared with conventional 3T TOF MRI and color Doppler imaging in both groups. Results: We included a group of 15 control patients and another group of 9 moyamoya patients between March 2023 and March 2024. The patients had an average age of 45 ± 14 years (65% male). Perforating arteries were captured on all subjects, with a mean diameter of 0.8 ± 0.3 mm in control patients, while it was not possible with TOF MRI or color Doppler (P < 0.05). Moreover, ULM enabled to highlight differences between healthy subjects and those with moyamoya disease through track mean distance (P = 0.05). Conclusions: Using a low-frame-rate ultrasound scanner, CEUS and accessible post-processing tools, we demonstrate that transcranial ULM can facilitate the visualization and characterization of perforating arteries, even in cases where they were previously undetectable using standard non-invasive imaging techniques. We speculate that with the advent of high-frame-rate 3D ULM, this technique may find widespread utility in hospitals.

Keywords: ULM; moyamoya; super-resolution; transcranial; ultrasound.


Conflict of interest statement

Competing Interests: O.C., holds patents in the field of ultrasound localization microscopy (EP4011299A1). O.C. is co-founder and shareholder of the ResolveStroke startup.

Figures

Figure 1
Figure 1
Study population. 24 patients were included, with 15 of them from a control group and 9 others with Moyamoya symptoms.
Figure 2
Figure 2
Steps of 2D transcranial ULM, example on patient n°1. A) Acquisition of clips, sorting of images with high noise level or large motion (SF1) and adjusting the TGC settings, B) Estimation of the binary perfusion mask (SF2), with typical MCA and noise patterns highlighted in C), D) Localization of concentrated MB by 10-pixel Gaussian correlation, E) Localization of isolated MB by 30-pixel Gaussian correlation, F) Tracking step with merged localization of MB, G) Accumulation of the tracks and reconstruction of a density map. Same scale everywhere: 1 cm.
Figure 3
Figure 3
ULM density maps on control patients. A) ULM density map on patient 1, right temporal window. White dotted lines indicate segmented vessels. The blue square represents the zoomed area in B), C) Density as a function of the lateral cross-section of the first segmented vessel. The full width at half maximum (FWHM) corresponds to the vessel diameter, i.e. 0.6 mm here. D) ULM density map on patient 8, left temporal window. White dotted lines indicate segmented vessels. E) ULM density map on patient 10, left temporal window. White dotted lines indicate segmented vessels. All color bars represent the density, i.e. count of microbubbles per pixel (in the arbitrary unit, a.u.). Scale bars of 1 cm. M1: sphenoidal segment of the MCA (Middle Cerebral Artery), M2: insular segment of the MCA, ACA: Anterior Cerebral Artery, PCA: Posterior Cerebral Artery.
Figure 4
Figure 4
Comparison of vessel density in MRI, ULM, and color Doppler in control patients. A) Position of the phased-array ultrasound probe on the right temporal window in patient 1. Probe is superimposed on a 3D TOF MRI volume in a profile view, B) the yellow-framed slice corresponds to the registered TOF MRI slice in an axial view. C) ULM density map on the first patient (control group). White dotted lines indicate perforating arteries' area segmentation, D) MRI TOF 3T of the same patient registered in b). White dotted lines indicate perforating arteries' area segmentation, E) Color doppler of the same patient. White dotted lines indicate perforating arteries' area segmentation, F) Comparison of vessel density, i.e. number of pixels superior to the median intensity of the image, between the three techniques. One-way ANOVA test (see Methods). Scale bars of 1 cm. Radiological notation, D: Dorsal, V: Ventral, Cr: Cranial, Ca: Caudal, P: Posterior, A: Anterior, R: Right, L: Left.
Figure 5
Figure 5
Comparison of vessel density in MRI, ULM, and color Doppler in Moyamoya patients. A) ULM density map on the patient n°16 (Moyamoya group). White dotted lines indicate perforating arteries' area segmentation, B) MRI TOF 3T of the same patient (axial view). White dotted lines indicate perforating arteries' area segmentation, C) Color doppler of the same patient. White dotted lines indicate perforating arteries' area segmentation, D) Comparison of vessel density, i.e. number of pixels superior to the median intensity of the image, between the three techniques. One-way ANOVA test (see Methods). Scale bars of 1 cm. Radiological notation, P: Posterior, A: Anterior, R: Right, L: Left.
Figure 6
Figure 6
Comparison of ULM density maps between control and Moyamoya patients. A) ULM density map of control patient #1 right temporal window, colormap from 0 to 4.5 (a.u.), B) ULM density map of control patients #8 left temporal window, colormap from 0 to 5 (a.u.), C) ULM density map of Moyamoya patient #16 left temporal window, colormap from 0 to 3.5 (a.u.), D) ULM density map of Moyamoya patient #18 left temporal window, colormap from 0 to 2.5 (a.u.). E) Number of localizations per cm² inside perforating arteries' region between Moyamoya and control patients, F) Number of tracks per cm² inside perforating arteries' region between Moyamoya and control patients, G) Number of at least 8 pixels connected objects (a.u.), i.e. perforating arteries, inside perforating arteries' region between Moyamoya and control patients. H) Mean distance between tracks (px) inside perforating arteries' region between Moyamoya and control patients. Same color bar for all patients. White dotted lines indicate perforating arteries' area segmentation. Radiological notation, P: Posterior, A: Anterior, R: Right, L: Left. Student t-tests were performed to compare the two groups (see Methods)

References

    1. Djulejić V, Marinković S, Maliković A, Jovanović I, Djordjević D, Ćetković M. et al. Morphometric analysis, region of supply and microanatomy of the lenticulostriate arteries and their clinical significance. J Clin Neurosci. 2012;19(10):1416–21. - PubMed
    1. Binder NF, El Amki M, Glück C, Middleham W, Reuss AM, Bertolo A. et al. Leptomeningeal collaterals regulate reperfusion in ischemic stroke and rescue the brain from futile recanalization. Neuron. 2024 May 1;112(9):1456–72. - PubMed
    1. Scott RM, Smith ER. Moyamoya disease and moyamoya syndrome. N Engl J Med. 2009;360(12):1226–37. - PubMed
    1. Suzuki JI, Kodama NA. Moyamoya disease-a review. Stroke. 1983;14(1):104–9. - PubMed
    1. Matsushige T, Kraemer M, Sato T, Berlit P, Forsting M, Ladd ME. et al. Visualization and classification of deeply seated collateral networks in moyamoya angiopathy with 7T MRI. Am J Neuroradiol. 2018;39(7):1248–54. - PMC - PubMed

LinkOut - more resources