. 2025 Apr 11:13:RP97334.
doi: 10.7554/eLife.97334.

Dynamic gamma modulation of hippocampal place cells predominates development of theta sequences

Affiliations

Dynamic gamma modulation of hippocampal place cells predominates development of theta sequences

Ning Wang et al. Elife. .

Abstract

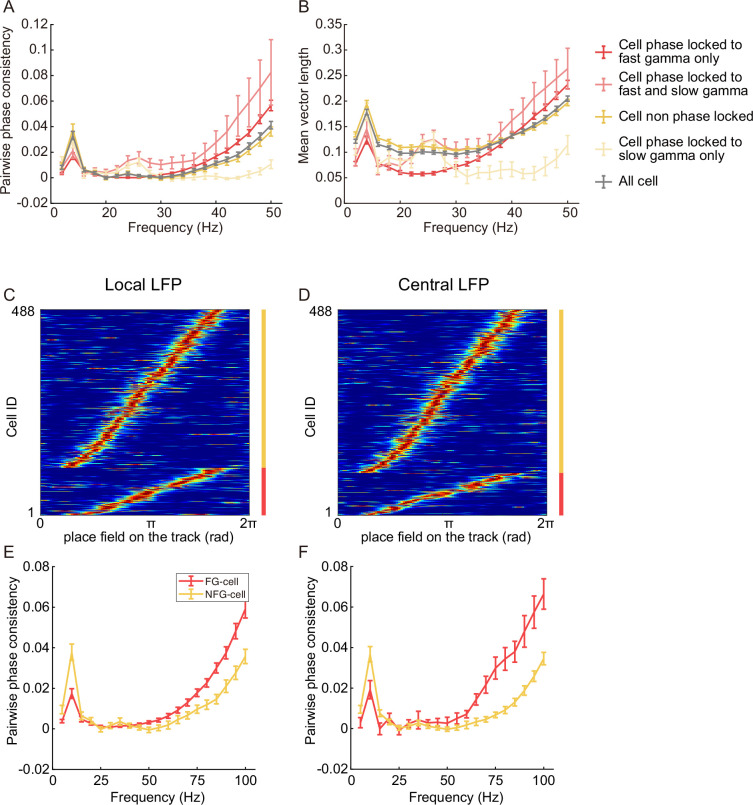
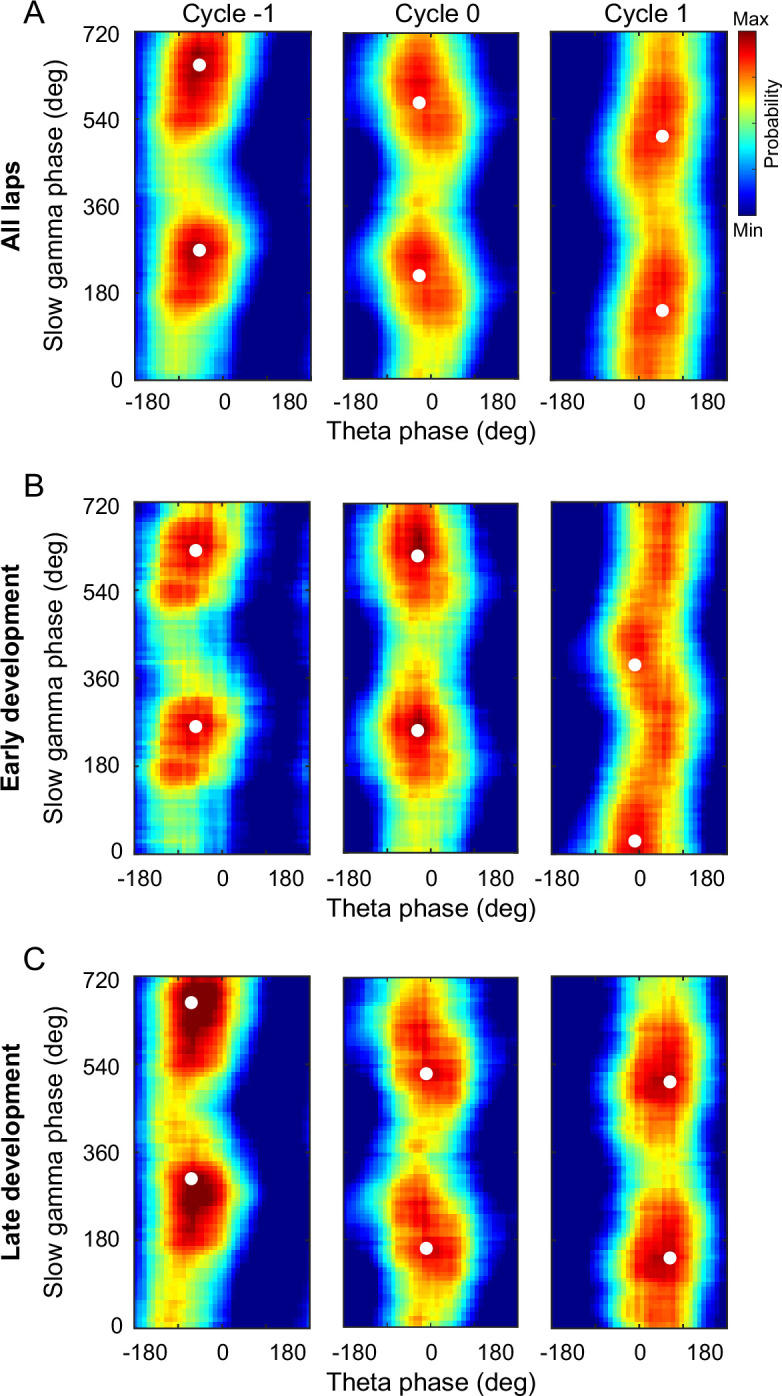
The experience-dependent spatial cognitive process requires sequential organization of hippocampal neural activities by theta rhythm, which develops to represent highly compressed information for rapid learning. However, how the theta sequences were developed in a finer timescale within theta cycles remains unclear. In this study, we found in rats that sweep-ahead structure of theta sequences developing with exploration was predominantly dependent on a relatively large proportion of FG-cells, that is a subset of place cells dominantly phase-locked to fast gamma rhythms. These ensembles integrated compressed spatial information by cells consistently firing at precessing slow gamma phases within the theta cycle. Accordingly, the sweep-ahead structure of FG-cell sequences was positively correlated with the intensity of slow gamma phase precession, in particular during early development of theta sequences. These findings highlight the dynamic network modulation by fast and slow gamma in the development of theta sequences which may further facilitate memory encoding and retrieval.

Keywords: gamma rhythms; hippocampus; neuroscience; phase precession; place cells; rat; theta sequence.


Conflict of interest statement

NW, YW, MG, LW, XW, NZ, JY, LW, CZ, DM No competing interests declared

Figures

Figure 1.
Figure 1.. The schematic of a model for theta sequence development.
Fast gamma rhythms coordinate a subgroup of place cells, as their spikes are dominantly phase-locked to fast gamma rhythms (FG-cells). The development process of theta sequences is disrupted by excluding these FG-cells. A possible model would be that development of sweep-ahead structure of theta sequences is dependent on the slow gamma modulation, that is, slow gamma phase precession, whereby spatial information could be highly compressed within theta cycles. FG-cells are those cells exhibiting slow gamma phase precession within theta cycles since from the early stage of sequence development. However, the NFG-cells only excited slow gamma phase-locking during late stage, which may unlikely contribute to the sequence development.
Figure 2.
Figure 2.. A subset of hippocampal place cells was modulated by fast gamma rhythms during active exploration.
(A) An example of simultaneously recorded local field potentials (LFPs) (raw LFP; theta: 4–12 Hz; slow gamma: 25–45 Hz; fast gamma: 65–100 Hz) and spikes of place cells. The troughs of theta were represented by dark gray vertical lines. Slow and fast gamma episodes were marked by dashed boxes and gray blocks. (B) Firing characteristics of two examples of FG- and NFG-cells, including turning curve, fast and slow gamma phase distribution during detected episodes. Spikes were represented by red rasters on top of the gamma traces. Mean vector length of each cell was shown above the gamma phase distribution. (C) The normalized turning curves of place cells sorted by the center of mass of their main place field. The proportion of four types of cells identified according to different modulation by fast and slow gamma was shown on the right. (D) Mean vector length of fast gamma phase distribution of FG- and NFG-cells across successive running laps (n = 12 sessions). Data are presented as mean ± SEM. ***p < 0.001.
Figure 2—figure supplement 1.
Figure 2—figure supplement 1.. Histological verification of tetrodes.
Histologic sections showing example recording sites in CA1 of four rats. The red triangle marks the location of tetrode tip in CA1 pyramidal layer.
Figure 2—figure supplement 2.
Figure 2—figure supplement 2.. Phase-locking as a function of frequency.
(A) Pairwise phase consistency (PPC) of four-type cell of Figure 2 in 5 Hz steps over a range of 0–100 Hz. (B) Same as (A) but for mean vector length. Legend color was same as Figure 2. Gray line indicated all 488 cells. (C, D) The normalized turning curves of FG-cells (red) and NFG-cells (yellow) detected according to the local local field potential (LFP) and consistent central LFP as reference, respectively. The number of FG-cells in (C) and (D) was 113 (23.2%) and 101 (20.7%). They were sorted by the center of mass of main place field. (E) The PPC of FG- and NFG-cells (n = 113 and 375 cells) in (C), modulated by all LFP frequency band (1–100 Hz). (F) The PPC of FG- and NFG-cells (n = 101 and 387 cells) in (D), modulated by all LFP frequency band (1–100 Hz). Data are presented as mean ± SEM.
Figure 2—figure supplement 3.
Figure 2—figure supplement 3.. Theta phase precession of FG- and NFG-cells.
(A) An example FG-cell with significant theta phase precession. Red line shows the linear-circular regression of scatter plots. (B) An example NFG-cell with significant theta phase precession. Yellow line shows the linear-circular regression of scatter plots. (C) An example of FG-cell without significant theta phase precession. (D) An example NFG-cell without significant theta phase precession. (E) Percentage of FG- and NFG-cells with or without significant theta phase precession. ***p < 0.001.
Figure 3.
Figure 3.. Theta sequences development was disrupted without FG-cells.
(A) Top: An example of color-coded decoded probability with time during a single lap. The running trajectory of the animal was indicated as white dashed line. Bottom: 4–12 Hz bandpass filtered theta rhythm, with cycles divided on trough indicated as red bars. (B) Examples of detected theta sequences decoded by three different decoders, all spikes from all cells (top, i.e. raw sequences), all spikes excluding those from FG-cells (middle, i.e. exFG-sequences) and all spikes excluding those from NFG-cells (bottom, i.e. exNFG-sequences). The white triangle indicates the animal’s current position. The white boxes indicate the center of sequences for calculating weighted correlation. (C) Weighted correlations of sequences among three types of decoders (n = 2423 sequences). (D) Averaged decoded probabilities for each lap, at a range of the animal’s current position ±63 cm and the mid-time point of theta sequence ±170 ms, of a single recording session. (E) Weighted correlation of raw sequences was significantly increased with running laps (n = 12 sessions). (F) The running speeds were maintained across laps. (G) The sweep-ahead structure of the exFG-sequences was disrupted compared to that of exNFG-sequences (n = 12 sessions). (H) The effect of excluding either FG- or NFG-cells at early (left) and late (right) development of theta sequences (n = 24 laps). Data are presented as mean ± SEM. *p < 0.05, **p < 0.01, ***p < 0.001.
Figure 3—figure supplement 1.
Figure 3—figure supplement 1.. Head direction across trials.
The polar coordinates’ histogram of angle difference between instantaneous head direction and angle of tangent vector along the circular track across laps (n = 12 sessions). The distribution of angle difference did not significantly change across laps.
Figure 4.
Figure 4.. Temporospatially compressed structure of theta sequences required a relatively large proportion of FG-cells.
(A) Examples of detected theta sequences in early development. Each column is a pair of theta sequences decoded by two different decoders, that is exFG- and exNFG-decoder, in a same theta cycle. The left two columns of sequences were detected from laps with a relatively small proportion (~10%) of FG-cells. The right two columns of sequences were detected from laps with a relatively large proportion (~35%) of FG-cells. Weighted correlation (W.Corr) of each sequence was shown. (B) Same as (A), but for late development of theta sequences. (C) The difference of weighted correlation between exFG- and exNFG-sequences as a function of the proportion of excluded cells, in early development. Each scatter represents data from each recording session (n = 12 sessions). The dashed line is the linear regression line. (D) Same as (C), but for late development of theta sequences.
Figure 5.
Figure 5.. Comparison of FG- and NFG-cells firing characteristics.
(A) Spatial tuning curves of representative FG- and NFG-cells during exploration on the circular track. Each column of cells exhibited similar place field positions on the track. (B) Distribution of the place field centers of mass (COM) of FG- and NFG-cells as a function of position on the track (n = 113 cells for FG-cells and downsampled n = 113 cells for NFG-cells). (C) Cumulative distribution of FG- and NFG-cells’ place field COM. (D) Mean firing rate, (E) excluded spike counts in decoding, (F) place field size, and (G) spatial information of FG- and NFG-cells (n = 12 sessions). Data are presented as mean ± SEM. *p < 0.05.
Figure 6.
Figure 6.. Slow gamma phase precession during early and late development of theta sequences.
(A) Probability distributions of slow gamma phases of spikes across successive slow gamma cycles within theta sequences. Gamma cycles within theta cycles were ordered, centered at cycle 0 (i.e., gamma cycle with maximal spiking). Slow gamma phases of spikes shifted systematically across successive slow gamma cycles. (B) Same as (A) but during early development of theta sequences. Spikes’ slow gamma phase did not significantly backward-shifted across first two slow gamma cycles. (C) Same as (A), but during late development of theta sequences. The white dots denote the peak probability of the histogram.
Figure 7.
Figure 7.. FG-cells constantly exhibited slow gamma phase precession across laps.
(A) Examples of slow gamma phase precession within theta cycles on single-cell level. The top row shows posterior probability for theta sequences. The middle row shows the local field potentials (LFPs) waveform in the same theta cycle of the theta sequence, with each slow gamma cycle divided by black lines. The bottom row shows the slow gamma phases of spikes from a representative cell activated in this theta cycle. The spikes occurred at earlier slow gamma phase in the late slow gamma cycles. (B) The averaged slow gamma phase shift across N active cycles were significantly negative (N = 2, 3, or ≥4). The red lines indicate the median and the black lines indicate the 25% and 75% quantile of group data (n = 12 sessions for N = 2 and N = 3, n = 9 sessions for N ≥ 4). (C) Histogram of mean slow gamma phase shift of theta cycles across laps. The histograms of real data are shown in blue with blue triangle indicating median. The histograms of mock data are shown in gray with black lines indicating the 95th confident interval of the their median. (D) The same as (C) but for histogram of mean slow gamma phase shift of place cells across laps. (E) Histogram of mean slow gamma phase shift of FG-cells (red) or NFG-cells (yellow) across laps. The red and yellow triangles are the median of phase shift in FG- and NFG-cells, respectively. *p < 0.05, **p < 0.01, ***p < 0.001.
Figure 8.
Figure 8.. The sweep-ahead structure of FG-cell sequences was positively correlated with the intensity of slow gamma phase precession during both early and late sequence development.
(A) Scatter plot of averaged slow gamma phase shift as a function of weighted correlation of sequences during all laps. Left panel shows real data (blue) and right panel shows mock data (gray). (B) Probability distributions of sequences falling in four quadrants (Q1–Q4) with slow gamma phase shift (<0 or >0) and weighted correlation (<0 or >0). (C) The count of sequences falling in Q1 (blue triangle) was significantly higher than 95% quantile of the shuffled data (black line). The gray histogram indicates the relative probability of mock data falling in Q1 by 1000 times shuffling. (D) Scatter plot of averaged slow gamma phase shift as a function of weighted correlation of FG-cell sequences during early development (top) and late development (bottom). (E) Probability distributions of FG-cell sequences falling in four quadrants during early development (top) and late development (bottom). (F) The count of FG-cell sequences falling in Q1 (red triangle) was significantly higher than 95% quantile of the shuffled data (black line) during both early development (top) and late development (bottom) of sequences. (G, H) Same as (D, E), but for NFG-cell sequences. (I) The count of NFG-cell sequences falling in Q1 (red triangle) was significantly higher than 95% quantile of the shuffled data (black line) only during late (bottom) but not early (top) development of sequences. *p < 0.05, ***p < 0.001.

Update of

  • doi: 10.1101/2024.03.27.586908
  • doi: 10.7554/eLife.97334.1
  • doi: 10.7554/eLife.97334.2
  • doi: 10.7554/eLife.97334.3

Similar articles

References

    1. Aoki Y, Yokoi T, Morikawa S, Kuga N, Ikegaya Y, Sasaki T. Effects of theta phase precessing optogenetic intervention on hippocampal neuronal reactivation and spatial maps. iScience. 2023;26:107233. doi: 10.1016/j.isci.2023.107233. - DOI - PMC - PubMed
    1. Belluscio MA, Mizuseki K, Schmidt R, Kempter R, Buzsáki G. Cross-frequency phase-phase coupling between θ and γ oscillations in the hippocampus. The Journal of Neuroscience. 2012;32:423–435. doi: 10.1523/JNEUROSCI.4122-11.2012. - DOI - PMC - PubMed
    1. Bieri KW, Bobbitt KN, Colgin LL. Slow and fast γ rhythms coordinate different spatial coding modes in hippocampal place cells. Neuron. 2014;82:670–681. doi: 10.1016/j.neuron.2014.03.013. - DOI - PMC - PubMed
    1. Buzsáki G, Schomburg EW. What does gamma coherence tell us about inter-regional neural communication? Nature Neuroscience. 2015;18:484–489. doi: 10.1038/nn.3952. - DOI - PMC - PubMed
    1. Buzsáki G, McKenzie S, Davachi L. Neurophysiology of remembering. Annual Review of Psychology. 2022;73:187–215. doi: 10.1146/annurev-psych-021721-110002. - DOI - PMC - PubMed

LinkOut - more resources