Review
. 2025 Oct;62(4):986-1008.
doi: 10.1002/jmri.29778. Epub 2025 Apr 11.

Functional Pulmonary Imaging

Affiliations
Review

Functional Pulmonary Imaging

Agilo L Kern et al. J Magn Reson Imaging. 2025 Oct.

Abstract

The aging of the world population gave rise to an increased prevalence of many lung diseases, with chronic obstructive pulmonary disease now ranking as the third-leading cause of death according to the World Health Organization. To diagnose lung disease, a thorough assessment of lung function is essential since it may reveal unique signatures in terms of disease pathophysiology. Yet, clinically established lung function tests are global measurements, which may compromise their sensitivity to early, regional changes in lung function compared to spatially resolved imaging tests. From a scientific perspective, the lung is a highly complex organ, and newly developed functional imaging methods may elucidate previously unknown aspects of its physiology. Functional pulmonary imaging is and will thus be of great value for both clinical and research applications. The goal of this review is to shed light on the field of functional pulmonary imaging in all its varieties, with a particular focus on the numerous tools MRI has to offer. This includes 1H MRI methods with or without exogenous contrast agents like oxygen- or gadolinium-based contrast agents and MRI of hyperpolarized and inert gases like 129Xe or perfluoropropane. However, thinking outside the box, a glance is also taken at what other modalities like single-photon emission computed tomography, computed tomography, or X-ray dark-field imaging have to offer. Following a physiological perspective, methods are described in terms of their ability to assess the key parameters of lung physiology in humans-ventilation, perfusion, and alveolar membrane function, as well as microstructure-and promising clinical and research applications are discussed. An outlook into possible future paths the field might take is given. Evidence Level: 5. Technical Efficacy: 2.

Keywords: alveolar membrane function; imaging; lung function; microstructure; perfusion; ventilation.


Figures

FIGURE 1
FIGURE 1
Overview of the methods available for functional lung imaging and described in this article. The methods for assessment of structure/membrane function are roughly sorted according to the length scales probed. CT, computed tomography; hp, hyperpolarized; OE, oxygen‐enhanced; SPECT, single‐photon emission computed tomography; UTE, ultra‐short echo time.
FIGURE 2
FIGURE 2
Ventilation imaging with hyperpolarized 129Xe in (a) a healthy volunteer (24‐year‐old male, FEV1 102.2% of predicted value) and (b) a patient with chronic obstructive pulmonary disease (73‐year‐old male, FEV1 55.4% of predicted value). 129Xe images (color) are overlaid over conventional anatomic 1H images (gray) within the thoracic cavity. Marked heterogeneity of ventilation is observed throughout the lung in the patient, whereas ventilation is very homogeneous in the healthy volunteer. FEV1, forced expiratory volume in 1 s.
FIGURE 3
FIGURE 3
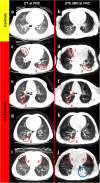
2D PREFUL ventilation maps (first row), perfusion maps (second row), and ventilation/perfusion match classification (third row) in an 18‐year‐old male cystic fibrosis patient before and 13 weeks after beginning treatment with triple combination therapy elexacaftor/tezacaftor/ivacaftor (ETI). PREFUL, phase‐resolved functional lung; QDP, perfusion defect percentage; QQuant, quantified perfusion; RVent, regional ventilation; VDP, ventilation defect percentage; VQM, ventilation/perfusion match.
FIGURE 4
FIGURE 4
3D PREFUL MRI regional ventilation maps (on the left), respective ventilation defect maps (in the middle), and 19F (on the right) ventilation defect maps for a 60‐year‐old male with chronic obstructive pulmonary disease (FEV1 53% of predicted value). Defect regions are color‐coded in red, gold arrows show the regional ventilation defect agreement, and blue arrows point out the regional differences. Sørensen–Dice coefficient was 61.8% and 48.2% for healthy and defect areas, respectively. FEV1, forced expiratory volume in 1 s; PREFUL, phase‐resolved functional lung.
FIGURE 5
FIGURE 5
Photon‐counting CT images of a patient with chronic thromboembolic hypertension (CTEPH). Photon‐counting CT allows a comprehensive assessment of the lung structure and vasculature (a, b) and function (ventilation and perfusion: c, d) with high spatial resolution. CT ventilation and perfusion (c, d) show high agreement with VQ‐SPECT (e, f). VQ‐SPECT, ventilation/perfusion single‐photon emission computed tomography.
FIGURE 6
FIGURE 6
(a) Maximum enhancement in a series of first‐pass dynamic contrast‐enhanced MR images as well as pulmonary blood flow map (b) in a pediatric cystic fibrosis patient (17‐year‐old female, FEV1 100% of predicted value). Perfusion defects are readily apparent mainly in the right lung. FEV1, forced expiratory volume in 1 s; PBF, pulmonary blood flow.
FIGURE 7
FIGURE 7
MR spectroscopy reveals that besides the strong resonance associated with gaseous 129Xe, there are two smaller resonances associated with 129Xe in membrane tissues (M) and 129Xe in red blood cells (RBCs). This allows the selective probing of the individual compartments in the gas uptake process.
FIGURE 8
FIGURE 8
(a) Anatomical virtual native CT images and (b) iodine maps in similar slice location as 129Xe dissolved‐phase ratio maps for M‐Gas (c) and RBC‐Gas (d) in a 73‐year‐old male patient with idiopathic pulmonary fibrosis. Heterogeneity of gas uptake is observed in both ratio maps. RBC, red blood cell, M, membrane tissues.
FIGURE 9
FIGURE 9
(a) 129Xe chemical shift saturation recovery (CSSR) sequence diagram and (b) uptake curves (ratio F of dissolved 129Xe over gaseous 129Xe) with model of xenon exchange (MOXE) fits in a healthy 29‐year‐old male volunteer and (c) a 73‐year‐old male patient with idiopathic pulmonary fibrosis. At short delay times, gas uptake is thought to be dominated by the lung surface–volume ratio. At intermediate delay times, uptake curves have a kink thought to be associated with the saturation of alveolar septa. Increased F at higher delay times is thought to be a consequence of blood flow. Increased septal thickness (15.4 μm vs. 8.1 μm) is apparent in the data from the fibrosis patient.
FIGURE 10
FIGURE 10
Hyperpolarized gas images with negligible diffusion weighting (b0) (a), apparent diffusion coefficient (ADC) maps (b), and ADC histograms (c) in a healthy child and two healthy adults. An increase in 129Xe ADC with age is apparent, suggesting an increase in airspace sizes in the growing lung. Reproduced with permission from [129]. F, female; M, male.
FIGURE 11
FIGURE 11
Alveolar duct radius R and alveolar sleeve depth h at multiple lung inflation levels (residual volume [RV] plus 1 L, functional residual capacity [FRC] plus 1 L and total lung capacity [TLC]) in a healthy volunteer. A reduction in the alveolar sleeve depth and an increase in the alveolar duct radius are observed. The relatively small magnitude of the increase in R may suggest alveolar recruitment as a relevant mechanism during respiration. Reproduced with permission from [134].
FIGURE 12
FIGURE 12
Measurement of the lung surface–volume (S/V) ratio using 19F (top row) and 129Xe (bottom row) diffusion‐weighted MR imaging at variable diffusion time in a patient with chronic obstructive pulmonary disease, forced expiratory volume in 1 s 63% of predicted value. Reproduced from [141], published under the terms of a Creative Commons Attribution License, https://creativecommons.org/licenses/by/4.0/.
FIGURE 13
FIGURE 13
Ultra‐short echo time (UTE) MRI and CT imaging in a healthy control and patients with cystic fibrosis (CF) obtained at functional residual capacity (FRC). Most features apparent on CT can also be observed in UTE MRI. Reprinted with permission of the American Thoracic Society [142]. Copyright © 2016 American Thoracic Society. All rights reserved. Annals of the American Thoracic Society is an official journal of the American Thoracic Society.
FIGURE 14
FIGURE 14
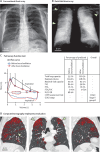
Conventional chest X‐ray and dark‐field X‐ray image (a/b) in a subject with chronic obstructive pulmonary disease with results from spirometry (c) and CT images (d). Emphysematous regions are readily apparent in the dark‐field X‐ray image but hard to see on conventional chest X‐ray. Reproduced from [146], published under the terms of a Creative Commons Attribution License, https://creativecommons.org/licenses/by/4.0/. COPD, chronic obstructive pulmonary disease; DLCO SB, diffusing capacity of the lung for carbon monoxide measured in a single breath; FEV1, forced expiratory volume in 1 s; FVC, forced vital capacity; GOLD, global initiative for chronic obstructive lung disease.

References

    1. World Health Organization , “The Top 10 Causes of Death,” (2020), https://www.who.int/news‐room/fact‐sheets/detail/the‐top‐10‐causes‐of‐death.
    1. Gehr P., Bachofen M., and Weibel E. R., “The Normal Human Lung: Ultrastructure and Morphometric Estimation of Diffusion Capacity,” Respiration Physiology 32 (1978): 121–140. - PubMed
    1. Grote J., “Die Sauerstoffdiffusionskonstanten im Lungengewebe und Wasser und ihre Temperaturabhängigkeit,” Pflügers Archiv für die Gesamte Physiologie des Menschen und der Tiere 295 (1967): 245–254. - PubMed
    1. Albert M. S., Cates G. D., Driehuys B., et al., “Biological Magnetic Resonance Imaging Using Laser‐Polarized 129Xe,” Nature 370, no. 6486 (1994): 199–201, 10.1038/370199a0. - DOI - PubMed
    1. Kauczor H.‐U., Ebert M., Kreitner K.‐F., et al., “Imaging of the Lungs Using 3He MRI: Preliminary Clinical Experience in 18 Patients With and Without Lung Disease,” Journal of Magnetic Resonance Imaging 7 (1997): 538–543. - PubMed