. 2025 Mar 22;14(7):482.
doi: 10.3390/cells14070482.

MIRO1 Is Required for Dynamic Increases in Mitochondria-ER Contact Sites and Mitochondrial ATP During the Cell Cycle

Affiliations

MIRO1 Is Required for Dynamic Increases in Mitochondria-ER Contact Sites and Mitochondrial ATP During the Cell Cycle

Benney T Endoni et al. Cells. .

Abstract

Mitochondria-ER contact sites (MERCS) are vital for mitochondrial dynamics, lipid exchange, Ca2+ homeostasis, and energy metabolism. We examined whether mitochondrial metabolism changes during the cell cycle depend on MERCS dynamics and are regulated by the outer mitochondrial protein mitochondrial rho GTPase 1 (MIRO1). Wound healing was assessed in mice with fibroblast-specific deletion of MIRO1. Wild-type and MIRO1-/- fibroblasts and vascular smooth muscle cells were evaluated for proliferation, cell cycle progression, number of MERCS, distance, and protein composition throughout the cell cycle. Restoration of MIRO1 mutants was used to test the role of MIRO1 domains; Ca2+ transients and mitochondrial metabolism were evaluated using biochemical, immunodetection, and fluorescence techniques. MERCS increased in number during G1/S compared with during G0, which was accompanied by a notable rise in protein-protein interactions involving VDAC1 and IP3R as well as GRP75 and MIRO1 by proximity-ligation assays. Split-GFP ER/mitochondrial contacts of 40 nm also increased. Mitochondrial Ca2+ concentration ([Ca2+]), membrane potential, and ATP levels correlated with the formation of MERCS during the cell cycle. MIRO1 deficiency blocked G1/S progression and the cell-cycle-dependent formation of MERCS and altered ER Ca2+ release and mitochondrial Ca2+ uptake. MIRO1 mutants lacking the Ca2+-sensitive EF hands or the transmembrane domain did not rescue cell proliferation or the formation of MERCS. MIRO1 controls an increase in the number of MERCS during cell cycle progression and increases mitochondrial [Ca2+], driving metabolic activity and proliferation through its EF hands.

Keywords: Ca2+; ER; MAM; MERCS; MIRO1; cell cycle; fibroblasts; mitochondria; vascular smooth muscle cells.


Conflict of interest statement

The authors declare no conflicts of interest. The funders had no role in the design of the study; in the collection, analyses, or interpretation of data; in the writing of the manuscript; or in the decision to publish the results.

Figures

Figure 1
Figure 1
MIRO1 is required for proliferation in vitro and wound healing in vivo. (A) Schematic depicting the genetic strategy used to generate fibroblast-specific MIRO1−/− mice. Miro1fl/fl mice were crossed with mice expressing tamoxifen-inducible, fibroblast-specific Cre recombinase, Col1a2CreERT. Tamoxifen was administered (80 mg/kg/day) for a total of 10 days to induce fibroblast-restricted Cre expression. (B) Representative immunoblot for MIRO1 in mitochondrial fractions of lysates from the skin of WT and Miro1−/− mice after wound closure. The quantification of MIRO1 protein is adjusted to COX IV; n = 5 mice per group. (C) Cell counts of skin fibroblasts explanted from WT and Miro1−/− mice incubated in media containing 10% FBS with and without PDGF for 72 h (20 ng/mL); n = 10 independent experiments. (D) Representative FACS analysis for DNA content in synchronized/growth-arrested WT and MIRO1−/− skin fibroblasts at 0 h and after release from arrest with 10% FBS for 24 h and 48 h. (E) Cell cycle phase distribution (% of cells) of skin fibroblasts in the G1, S, and G2/M phases; n = 4–6 independent experiments. (F) Representative images of wounds after intrascapular skin punch at days 0 (immediately after punch), 3, and 6 in WT and Miro1-/- mice. The scale depicted below the images represents 1 mm. (G) Quantification of wound areas. Data were normalized to the wound area at day 0; n = 14 mice per genotype. Data are shown as the mean ± SEM. Analyses were performed using the Mann–Whitney test (B), one-way ANOVA (C), two-way ANOVA (or mixed model) (E), or two-way ANOVA (G).
Figure 2
Figure 2
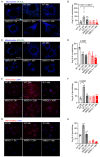
MIRO1 regulates the number of mitochondria–ER contacts during the cell cycle. (A) Representative images of VSMCs expressing a split-GFP-based contact-site sensor for wide juxtaposition (40–50 nm) between the ER and mitochondria (SPLICSL, green) colocalized with mitochondria (MitoTracker, blue) in WT and MIRO1−/− cells. Scale bar = 20 µm, ×63. (B) Quantification of SPLICSL in (A); n = 7–11 independent experiments. (C) Representative images of VSMCs expressing a split-GFP-based contact-site sensor for narrow juxtaposition (8–10 nm) between the ER and mitochondria (SPLICSS; green) colocalized with mitochondria (MitoTracker, blue) in WT and MIRO1−/− cells. Scale bar = 20 µm, ×63. (D) Quantification of SPLICSS in (C); n = 6 independent experiments. (E) Representative images of the in situ proximity ligation assay (PLA) between IP3R and VDAC1. PLA products are shown in red and the nucleus in blue (DAPI). Scale bar = 20 µm, ×40. (F) Quantification of the images in (E); n = 4 independent experiments. (G) Representative images of the in situ proximity ligation assay (PLA) between GRP75 and MIRO1. PLA products are shown in red and the nucleus in blue (DAPI). Scale bar = 20 µm, ×40. (H) Quantification of the images in (G); n = 2–4 independent experiments. Data are shown as the mean ± SEM. Analyzed using the Kruskal–Wallis test.
Figure 3
Figure 3
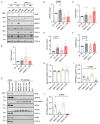
MIRO1 resides at MAM interfaces and interacts with Ca2+-transfer MERCS proteins. (A) Representative immunoblots for MERCS proteins in fractions of purified mitochondria (PM) and of mitochondria-associated membranes (MAMs) isolated from WT and MIRO1−/− skin fibroblasts following synchronization in serum-free medium (0 h) and at 24 h after release from growth arrest in medium containing 10% FBS. PM: purified mitochondria, MAM: mitochondria-associated membrane. Markers for MAMs and ER (FACL4) and mitochondria (cytochrome c oxidase (COX IV)) were also examined. VDAC1 was used as a loading control. (BF) Quantification of the immunoblot experiments as in (A). (B) MIRO1, (C) IP3R, (D) GRP75, (E) FACL4, and (F) VAPB levels, adjusted to VDAC1; n = 3–7 independent experiments. (G) Coimmunoprecipitation (co-IP) analysis of MIRO1 WT, MIRO1 KK, MIRO1 dnC, and MIRO1 ΔTM with MERCS proteins. c-Myc-tagged MIRO1 constructs were expressed in HEK cells for 24 h, and cell lysis and pull-down assays were performed. (HJ) Quantification of the co-IP experiments shown in (G). (H) MIRO1 expression in MIRO1 KK, MIRO1 dnC, and MIRO1 ΔTM adjusted to MIRO1 WT. (I) GRP75 and (J) MCU levels, adjusted for immunoprecipitated c-Myc-tagged MIRO1; n = 6 independent experiments. Data are shown as the mean ± SEM. Analyses were performed using the Kruskal–Wallis test.
Figure 4
Figure 4
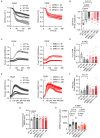
MIRO1 regulates changes in subcellular Ca2+ distribution during the cell cycle. (A) PDGF-induced ER Ca2+ release as assessed with CEPIA1er in synchronized/growth-arrested WT and MIRO1-/- VSMCs at 0 h and after release from arrest with 10% FBS for 24 h and 48 h. Arrows indicate the addition of PDGF (20 ng/mL). (B) Quantification of the peak amplitude of CEPIA1er recordings shown in (A); n = 8 independent experiments. (C) PDGF-induced cytosolic Ca2+ transients as assessed with Fura 2-AM in synchronized/growth-arrested WT and MIRO1−/− VSMCs at 0 h and after release from arrest with 10% FBS for 24 h and 48 h. Arrows indicate the addition of PDGF (20 ng/mL). (D) Quantification of the peak amplitude of Fura 2-AM recordings shown in (C); n = 6 independent experiments. (E) PDGF-induced mitochondrial Ca2+ uptake as assessed with mtPericam in synchronized/growth-arrested WT and MIRO1-/- VSMCs at 0 h and after release from arrest with 10% FBS for 24 h and 48 h. Arrows indicate the addition of PDGF (20 ng/mL). (F) Quantification of the peak amplitude of mtPericam recordings shown in (E); n = 6 independent experiments. (G) Quantification of baseline mitochondrial [Ca2+] as assessed with mtPericam in synchronized/growth-arrested WT and MIRO1−/− VSMCs at 0 h and after release from arrest with 10% FBS for 24 h and 48 h; n = 7 independent experiments. (H) Quantification of the mitochondrial membrane potential as assessed by tetramethylrhodamine methyl ester (TMRM) fluorescence in synchronized/growth-arrested WT and MIRO1−/− VSMCs at 0 h and after release from arrest with 10% FBS for 24 h and 48 h; n = 8 independent experiments. Data are shown as the mean ± SEM. Analyses were performed using one-way ANOVA (B) and Kruskal–Wallis (D,FH) tests.
Figure 5
Figure 5
Loss of MIRO1 attenuates mitochondrial and cytosolic ATP levels. (A) Representative immunoblots of phosphorylated (inactive) pyruvate dehydrogenase (p-PDH) and total pyruvate dehydrogenase (t-PDH) in whole-cell lysates of WT and MIRO1−/− VSMCs at 0 h and after release from arrest with 10% FBS for 24 h. (B) Quantification of p-PDH (α1-ser293), adjusted to t-PDH. COX IV was used as a loading control; n = 4 independent experiments. (C) Quantification of mitochondrial ATP levels in synchronized/growth-arrested WT and MIRO1−/− VSMCs at 0 h and after release from arrest with 10% FBS for 24 h and 48 h; n = 9 independent experiments. (D) Representative images of WT and MIRO1-/- VSMCs transduced with adenovirus expressing the fluorescent ATP-sensitive protein pm-iATPSnFR1.0 synchronized/growth-arrested at 0 h and after release from arrest with 10% FBS for 24 h and 48 h. (E) Quantification of the cytosolic ATP levels shown in (D); n = 6 independent experiments. Data are shown as the mean ± SEM. Analyses were performed using the Friedman (B,E) and Kruskal–Wallis (C) tests.
Figure 6
Figure 6
MIRO1 EF hands and transmembrane domain is required for MERCS formation, increased ATPlevels and cell proliferation in skin fibroblasts. (A) Representative images of WT skin fibroblasts and MIRO1−/− skin fibroblasts expressing MIRO1 KK, MIRO1 dnC, or MIRO1 ΔTM and a split-GFP-based contact-site sensor for wide juxtaposition (40–50 nm) between the ER and mitochondria (SPLICSL; green) colocalized with mitochondria (MitoTracker; blue) after release from arrest with 10% FBS for 24 h. Scale bar = 20 µm, ×63. (B) Quantification of the SPLICSL shown in (A); n = 30 to 65 cells for each group from 5 independent experiments. (C) Quantification of mitochondrial ATP levels at 24 h in WT skin fibroblasts and MIRO1−/− skin fibroblasts expressing MIRO1 KK, MIRO1 dnC, or MIRO1 ΔTM after release from growth arrest with 10% FBS; n = 12 independent experiments. (D) Cell counts of WT skin fibroblasts and MIRO1−/− skin fibroblasts incubated in media containing 10% FBS with and without PDGF for 72 h (20 ng/mL); n = 10 independent experiments. (E) Cell counts of MIRO1−/− skin fibroblasts expressing MIRO1 WT, MIRO1 KK, MIRO1 dnC, or MIRO1 ΔTM incubated in media containing 10% FBS with and without PDGF for 72 h (20 ng/mL); n = 10 independent experiments. Data are shown as the mean ± SEM. Analyses were performed using Kruskal–Wallis (B,D,E) and one-way ANOVA (C) tests.

Similar articles

Cited by

References

    1. Kornmann B., Currie E., Collins S.R., Schuldiner M., Nunnari J., Weissman J.S., Walter P. An ER-mitochondria tethering complex revealed by a synthetic biology screen. Science. 2009;325:477–481. - PMC - PubMed
    1. Csordas G., Varnai P., Golenar T., Roy S., Purkins G., Schneider T.G., Balla T., Hajnoczky G. Imaging interorganelle contacts and local calcium dynamics at the ER-mitochondrial interface. Mol. Cell. 2010;39:121–132. doi: 10.1016/j.molcel.2010.06.029. - DOI - PMC - PubMed
    1. Rowland A.A., Voeltz G.K. Endoplasmic reticulum–mitochondria contacts: Function of the junction. Nat. Rev. Mol. Cell Biol. 2012;13:607–615. - PMC - PubMed
    1. Kornmann B., Walter P. ERMES-mediated ER-mitochondria contacts: Molecular hubs for the regulation of mitochondrial biology. J. Cell Sci. 2010;123:1389–1393. doi: 10.1242/jcs.058636. - DOI - PMC - PubMed
    1. Ardail D., Popa I., Bodennec J., Louisot P., Schmitt D., Portoukalian J. The mitochondria-associated endoplasmic-reticulum subcompartment (MAM fraction) of rat liver contains highly active sphingolipid-specific glycosyltransferases. Biochem. J. 2003;371:1013–1019. doi: 10.1042/BJ20021834. - DOI - PMC - PubMed

Publication types

LinkOut - more resources