

Dielectric Responses of Cytosolic Water Change with Aging of Circulating Red Blood Cells
- PMID: 40214440
- PMCID: PMC11987982
- DOI: 10.3390/cells14070486
Dielectric Responses of Cytosolic Water Change with Aging of Circulating Red Blood Cells
Abstract
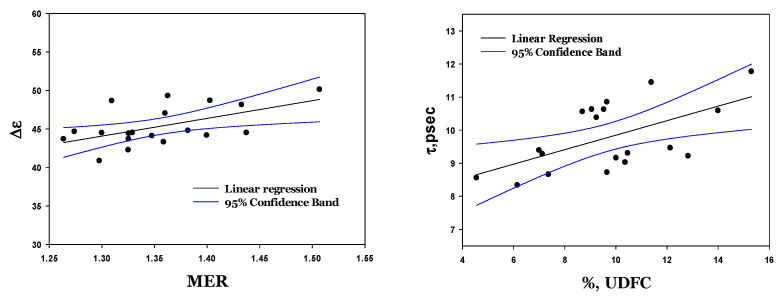
Water molecules in the cytosol of red blood cells (RBCs) may exist in a free or bound state. The ratio between the free and bound water depends on the composition of the cytoplasm, particularly on the hemoglobin concentration. Microwave dielectric spectroscopy (MDS) provides information on the state of intracellular water in red blood cell suspension and the erythrocyte cytosol state. In the presented study, we used MDS to assess the differences in the free-to-bound water ratio in subpopulations of freshly donated human erythrocytes of different ages (young, mature, and senescent cells) obtained by fractionation in a Percoll density gradient. The obtained MDS parameters (dielectric strength ∆ε, the relaxation time τ, and the broadening parameter α) were compared with the red blood cell indices and single cell deformability measurements obtained for each subpopulation. We demonstrated that the unique hematological indices and deformability of red blood cells of different ages are well-correlated with the specific values of dielectric fitting parameters. The obtained results indicate that the dielectric properties of cytosolic water can serve as a sensitive marker of changes occurring in the cytosol of red blood cells during cell aging.
Keywords: Percoll gradient; RBC aging; hematological indices; microwave dielectric spectroscopy; red blood cells.
Conflict of interest statement
The authors declare no conflicts of interest.
Figures


Similar articles
-
The inhibition of glucose uptake to erythrocytes: microwave dielectric response.Eur Biophys J. 2022 Jul;51(4-5):353-363. doi: 10.1007/s00249-022-01602-3. Epub 2022 May 9. Eur Biophys J. 2022. PMID: 35532810
-
The effect of ionic redistributions on the microwave dielectric response of cytosol water upon glucose uptake.Eur Biophys J. 2024 May;53(4):183-192. doi: 10.1007/s00249-024-01708-w. Epub 2024 Apr 22. Eur Biophys J. 2024. PMID: 38647542
-
Dielectric Response of Cytoplasmic Water and Its Connection to the Vitality of Human Red Blood Cells. II. The Influence of Storage.J Phys Chem B. 2017 May 25;121(20):5273-5278. doi: 10.1021/acs.jpcb.7b02662. Epub 2017 May 11. J Phys Chem B. 2017. PMID: 28453275
-
Deformability of Stored Red Blood Cells.Front Physiol. 2021 Sep 22;12:722896. doi: 10.3389/fphys.2021.722896. eCollection 2021. Front Physiol. 2021. PMID: 34690797 Free PMC article. Review.
-
Changes in human red blood cells during aging in vivo.Keio J Med. 1994 Sep;43(3):155-63. doi: 10.2302/kjm.43.155. Keio J Med. 1994. PMID: 7967311 Review.
References
-
- Henry M. The state of water in living systems: From the liquid to the jellyfish. Cell Mol. Biol. 2005;51:677–702. - PubMed
-
- Puzenko A., Levy E., Shendrik A., Talary M.S., Caduff A., Feldman Y. Dielectric spectra broadening as a signature for dipole-matrix interaction. III. Water in adenosine monophosphate/adenosine-5′-triphosphate solutions. J. Chem. Phys. 2012;137:194502–194508. doi: 10.1063/1.4766256. (In English) - DOI - PubMed
-
- Chaplin M. A proposal for the structuring of water. Biophys. Chem. 2000;83:211–221. - PubMed
Publication types
MeSH terms
Substances
Grants and funding
LinkOut - more resources
Full Text Sources
Research Materials
Miscellaneous
