

The Assessment of the Effect of Autophagy Inhibitors-Chloroquine and 3-Methyladenine on the Antitumor Activity of Trametinib Against Amelanotic Melanoma Cells
- PMID: 40214510
- PMCID: PMC11988765
- DOI: 10.3390/cells14070557
The Assessment of the Effect of Autophagy Inhibitors-Chloroquine and 3-Methyladenine on the Antitumor Activity of Trametinib Against Amelanotic Melanoma Cells
Abstract
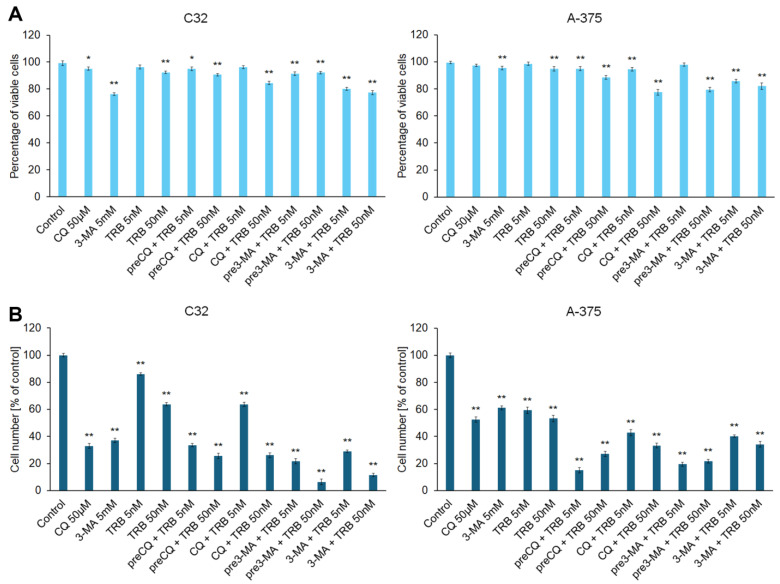
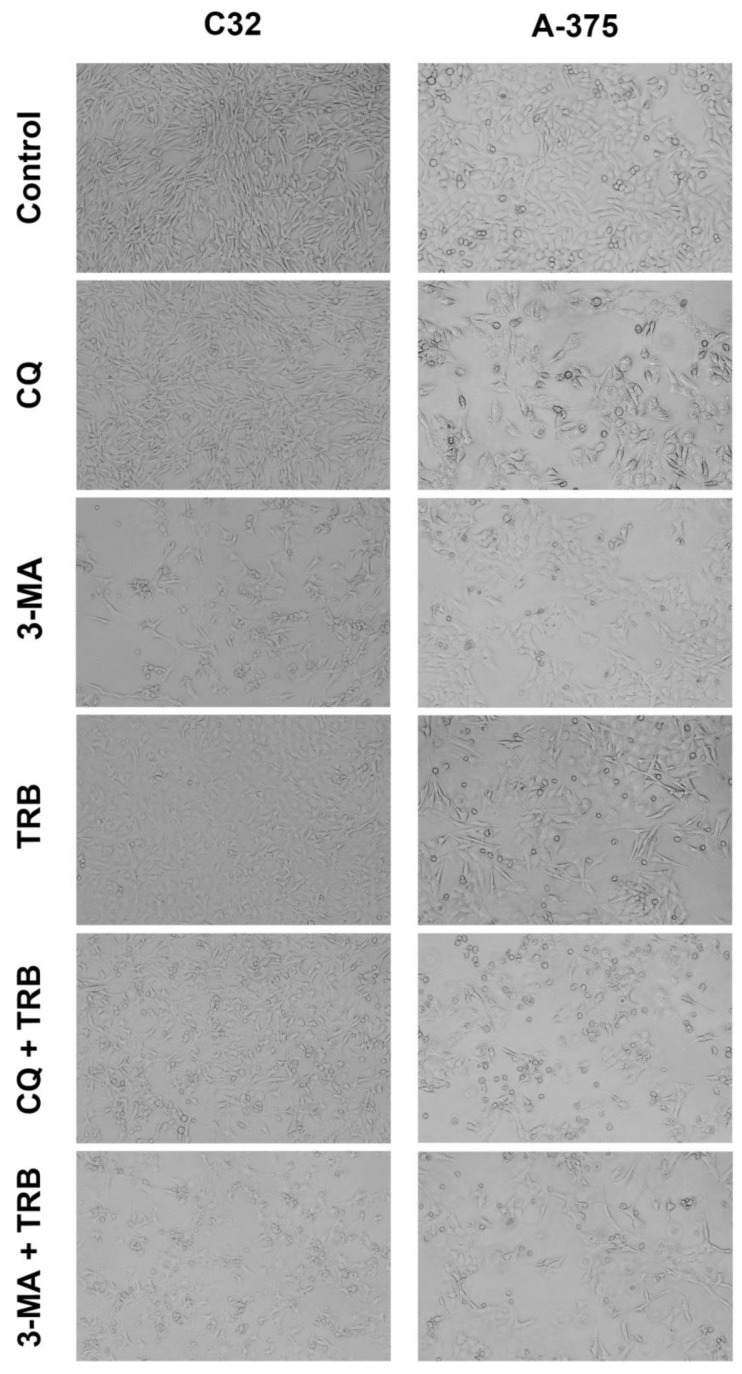
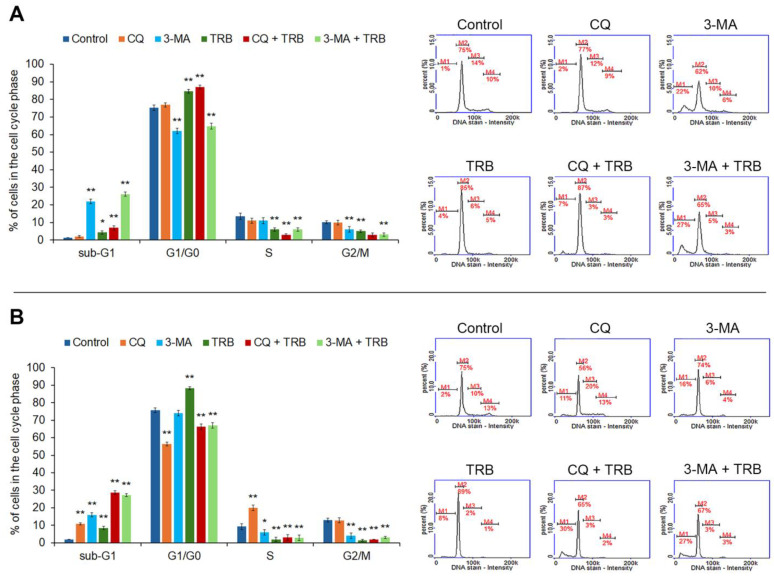
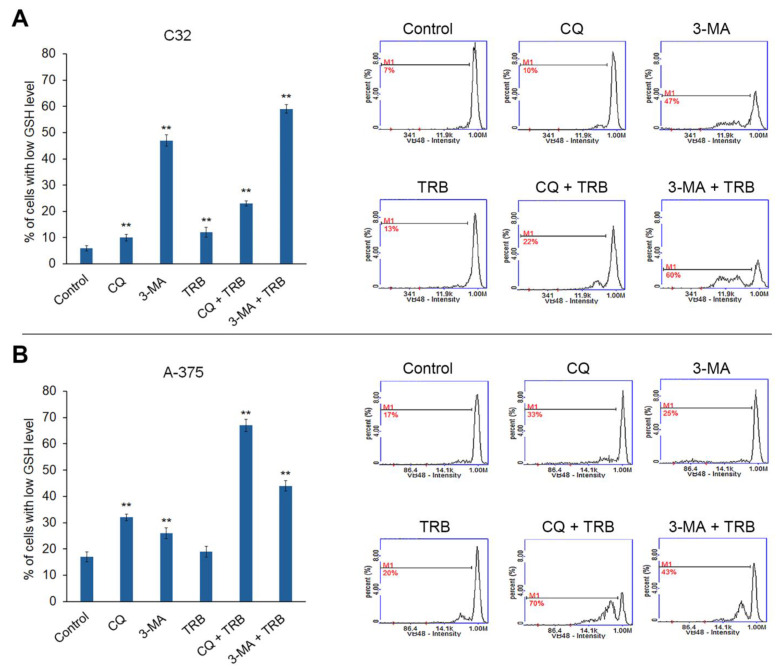
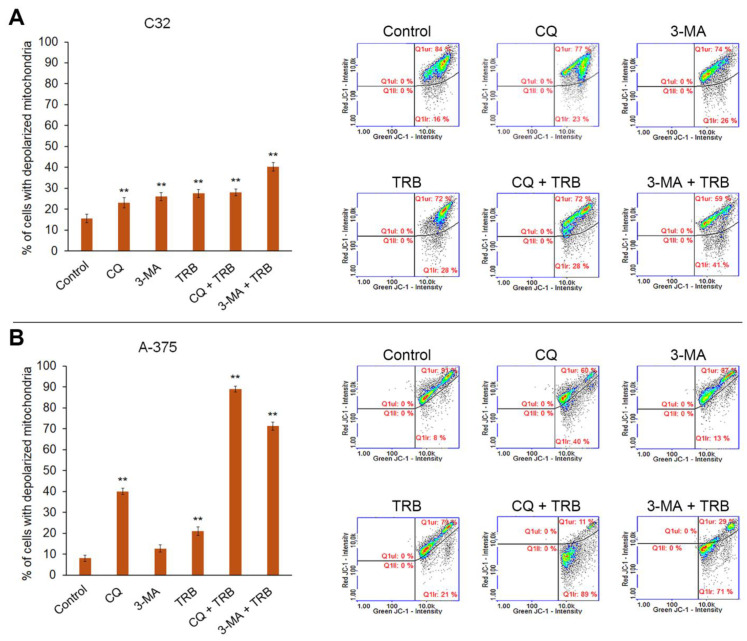
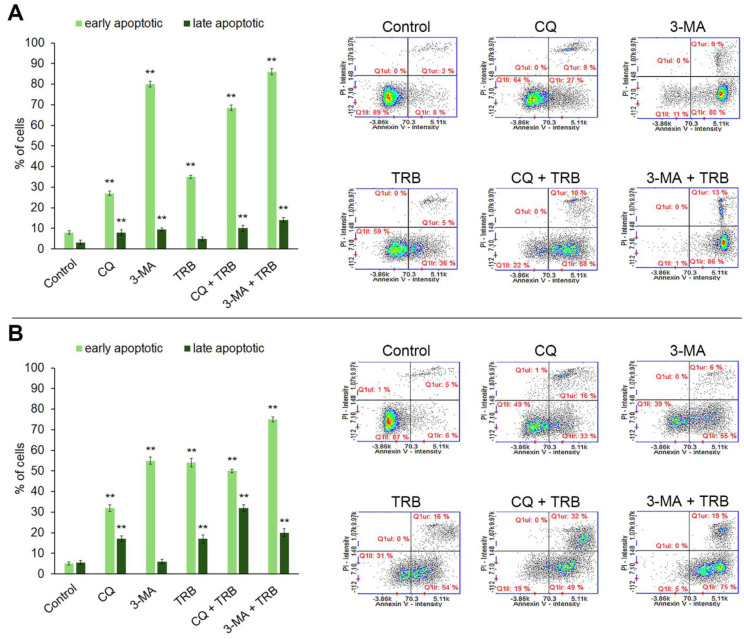
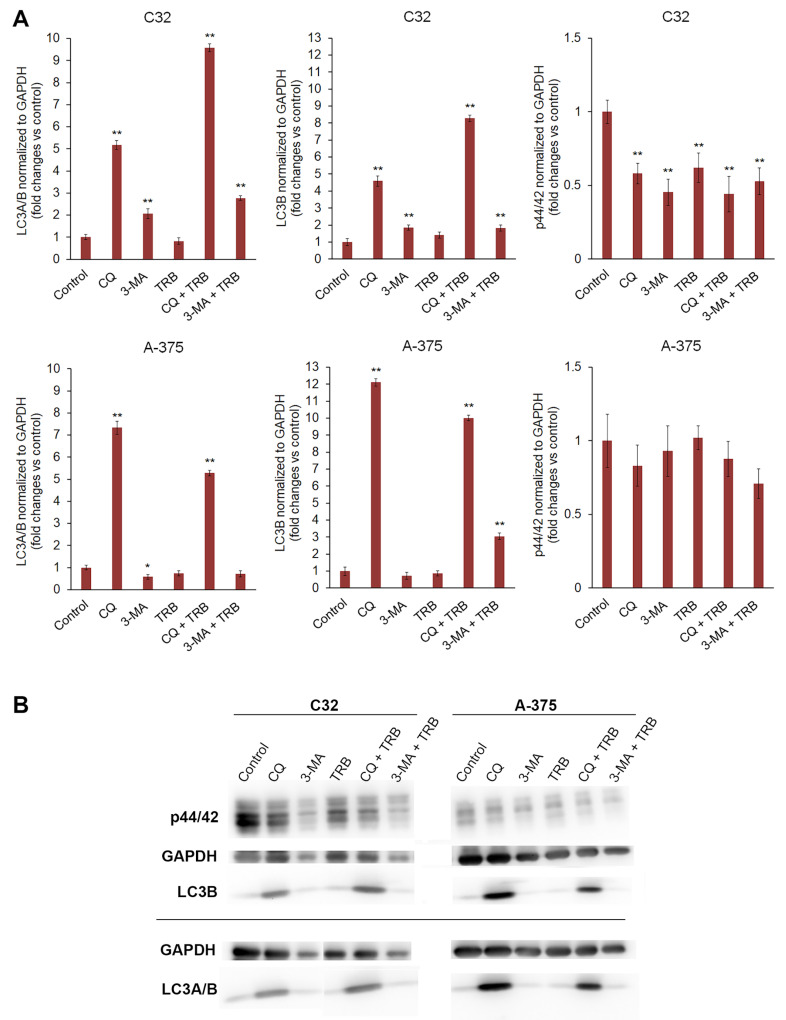
Malignant melanoma, particularly amelanotic melanoma, contributes to a very serious problem in public health. One way to find new therapies is to learn about and understand the molecular pathways that regulate cancer growth and development. In the case of a tumor, the autophagy process can lead to the development or inhibition of cancer. This study aimed to assess the cytotoxicity of connection trametinib (MEK1 and MEK2 kinase inhibitor) with autophagy inhibitors-chloroquine (lysosomal clearance of autophagosomes inhibitor) and 3-methyladenine (phosphatidylinositol 3-kinases inhibitor), on two amelanotic melanoma cell lines (C32 and A-375). The results showed that combination therapy had better anti-proliferative effects than alone therapy in both cell lines. The C32 cell line was more sensitive to 3-methyladenine treatment (alone and in combinations), and the A375 line showed sensitivity to chloroquine and 3-methyladenine (alone and in combinations). The anti-proliferative effect was accompanied by dysregulation of the cell cycle, a decrease in the reduced thiols, the depolarization of the mitochondrial membrane and the level of p44/p42 MAPK. Both inhibitors have the ability to induce apoptosis. Differences in the level of LC3A/B and LC3B proteins between the chloroquine and the 3-methyladenine samples indicate that these drugs inhibit autophagy at different stages. The enhancement of the effect of trametinib by autophagy inhibitors suggests the possibility of combining drugs with anti-cancer potential with modulators of the autophagy process.
Keywords: 3-methyladenine; LC3A/B; LC3B; apoptosis; autophagy; chloroquine; trametinib.
Conflict of interest statement
The authors declare no conflicts of interest. The funders had no role in the design of the study; in the collection, analyses, or interpretation of data; in the writing of the manuscript; or in the decision to publish the results.
Figures
Similar articles
-
Chloroquine Sensitizes GNAQ/11-mutated Melanoma to MEK1/2 Inhibition.Clin Cancer Res. 2020 Dec 1;26(23):6374-6386. doi: 10.1158/1078-0432.CCR-20-1675. Epub 2020 Sep 15. Clin Cancer Res. 2020. PMID: 32933997 Free PMC article.
-
The Anticancer Potential of Doxycycline and Minocycline-A Comparative Study on Amelanotic Melanoma Cell Lines.Int J Mol Sci. 2022 Jan 13;23(2):831. doi: 10.3390/ijms23020831. Int J Mol Sci. 2022. PMID: 35055021 Free PMC article.
-
Cytotoxic and Antitumor Activity of Lactaptin in Combination with Autophagy Inducers and Inhibitors.Biomed Res Int. 2019 Jun 17;2019:4087160. doi: 10.1155/2019/4087160. eCollection 2019. Biomed Res Int. 2019. PMID: 31317028 Free PMC article.
-
Allosteric MEK1/2 inhibitors including cobimetanib and trametinib in the treatment of cutaneous melanomas.Pharmacol Res. 2017 Mar;117:20-31. doi: 10.1016/j.phrs.2016.12.009. Epub 2016 Dec 9. Pharmacol Res. 2017. PMID: 27956260 Review.
-
Trametinib: a novel signal transduction inhibitor for the treatment of metastatic cutaneous melanoma.Am J Health Syst Pharm. 2015 Jan 15;72(2):101-10. doi: 10.2146/ajhp140045. Am J Health Syst Pharm. 2015. PMID: 25550132 Review.
Cited by
-
Distinct Types of Regulated Cell Death in Melanoma.Cells. 2025 Jun 1;14(11):823. doi: 10.3390/cells14110823. Cells. 2025. PMID: 40497999 Free PMC article. Review.
References
-
- Garbe C., Amaral T., Peris K., Hauschild A., Arenberger P., Basset-Seguin N., Bastholt L., Bataille V., Del Marmol V., Dréno B., et al. European Dermatology Forum (EDF), the European Association of Dermato-Oncology (EADO), and the European Organization for Research and Treatment of Cancer (EORTC). European consensus-based interdisciplinary guideline for melanoma. Part 1: Diagnostics: Update 2022. Eur. J. Cancer. 2022;170:236–255. doi: 10.1016/j.ejca.2022.03.008. - DOI - PubMed
Publication types
MeSH terms
Substances
Grants and funding
LinkOut - more resources
Full Text Sources
Miscellaneous
