. 2025 Aug 1;157(3):573-587.
doi: 10.1002/ijc.35441. Epub 2025 Apr 11.

A strategy for multimodal integration of transcriptomics, proteomics, and radiomics data for the prediction of recurrence in patients with IDH-mutant gliomas

Affiliations

A strategy for multimodal integration of transcriptomics, proteomics, and radiomics data for the prediction of recurrence in patients with IDH-mutant gliomas

Tiffanie Chouleur et al. Int J Cancer. .

Abstract

Isocitrate dehydrogenase-mutant gliomas are lethal brain cancers that impair quality of life in young adults. Although less aggressive than glioblastomas, IDH-mutant gliomas invariably progress to incurable disease with unpredictable recurrence. A better classification of patient risk of recurrence is needed. Here, we describe a multimodal analytical pipeline integrating imaging, transcriptomic, and proteomic profiles using machine learning to improve patient stratification with novel signatures of patient risk of recurrence based on gene expression, protein level, and imaging. Additionally, we describe the biological characteristics of IDH-mutant glioma subtypes categorized by positron emission tomography (PET) and histology, and we reinforce the integration of positron emission tomography (PET) metrics in the classification of IDH-mutant gliomas. We identify a gene signature (KRT19, RUNX3, and SCRT2) and a protein signature (ATXN10, EIF4H, ITGAV, and NCAM1) associated with an increased risk of early recurrence. Furthermore, we integrated these markers with imaging-derived features, obtaining a better stratification of IDH-mutant glioma patients in comparison to histomolecular classification alone.

Keywords: IDH‐mutant glioma; multimodal integration; proteomic; radiomic; transcriptomic.


Conflict of interest statement

The authors declare no conflicts of interest.

Figures

FIGURE 1
FIGURE 1
Characteristics of the patients included in the study. (A) Overview of the study describing the procedures (MRI, PET, and surgery) with the data and sample collection throughout patient follow‐up (left panel), analyses performed (middle panel) and outcomes (right panel). VOI: Volume of interest; FFPE: Formalin‐fixed paraffin‐embedded; LC–MS: Liquid chromatography–mass spectrometry. (B) Representative11C‐METH PET scan from PETpos and PETneg patients (left to right: FLAIR [fluid attenuated inversion recovery], T1 post gadolinium and 11C‐METH PET). (C) Venn diagram displaying the number of patients included in each type of data collected during the study.
FIGURE 2
FIGURE 2
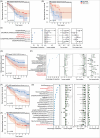
PETneg and PETpos gliomas as well as astrocytoma and oligodendroglioma have similar recurrence probabilities but distinct biological properties. (A, B) K–M curves showing no significant difference in recurrence probability between PETneg and PETpos or between astrocytoma and oligodendroglioma patients. Log‐rank p‐value = 0.15. (C,D) Heatmaps of GSVA results for the PET groups obtained via transcriptomics and proteomics. (E) Heatmap of GSVA results for the histology group and transcriptomics data. p‐value <0.05. The gene sets are associated with GO terms and biological pathways. Only the 20 most significant pathways are displayed.
FIGURE 3
FIGURE 3
Integration of PET data into the classification of IDH‐mutant glioma patients. (A) Distribution of patients according to PET status and histology. The chi‐square test p‐value = 0.000258. (B) K–M curves showing the difference in RFS based on PET and histological stratification. The log‐rank p‐value = 0.017. (C) Heatmap of the GSVA with transcriptomics results. p‐value <0.05. The gene sets are associated with GO terms and biological pathways. Only the 20 most significant pathways are displayed.
FIGURE 4
FIGURE 4
Prognostic significance of the genes and proteins linked to recurrence. (A, E) Strategy used to determine and validate the recurrence gene signature and protein signature, respectively. For a detailed description, see the Materials and Methods section. (B, F) The minimal signature for recurrence based on genes and proteins. A log‐rank p‐value <0.05 was used. (C, G) Significance of the signature compared to 1000 random signatures. (D) Recurrence‐free survival of patients stratified according to SCRT2, KRT19, and RUNX3 expression based on the median cutoff. A log‐rank p‐value <0.05 was used. (H) Recurrence‐free survival of patients stratified according to ATXN10, EIF4H, ITGAV, and NCAM1 protein levels based on the median cutoff. A log‐rank p‐value <0.05 was used. (I, J) Forest plots of the association between signatures and risk of recurrence according to multivariate Cox regression analysis.
FIGURE 5
FIGURE 5
Radiomic signatures of recurrence risk. (A–C) MRI‐based radiomic signature. (A) Recurrence‐free survival of patients stratified by the MRI‐based radiomic signature. (B) Recurrence‐free survival of patients in the validation dataset stratified by the MRI‐based radiomic signature after propensity score matching. (C) Description of features selected by LASSO, with their selection rate in LASSO, LASSO nonzero weight distribution, and Cox statistics. (D, E) PET‐based radiomic signature with (D) recurrence‐free survival of patients stratified by the signature and (E) the features selected by LASSO. (F–H) MRI + PET‐based radiomic signatures with (F, H) recurrence‐free survival of patients stratified by the signatures 435 and 416, respectively, and (G) the features selected by LASSO. The 435 signature was composed of ClusterShade MRI,GLCM , Idn MRI,GLCM , and GrayLevelVariance PET,GLSZM ; the 416 signature was composed of SUVmax and ClusterShade MRI,GLCM . All Kaplan–Meier curves are shown after propensity score matching. Log‐rank p‐values <0.05 except for (A), for which the p‐value <0.10. In red, features selected in the signatures.
FIGURE 6
FIGURE 6
Cross signatures of recurrence risk. (A) General workflow showing the molecular signature associated with imaging features to obtain cross‐signatures that were tested in our cohort or the validation cohort. (B–E) Kaplan–Meier curves of the indicated signatures after propensity score matching. For each cross‐signature, we first calculated the molecular signature (1) on the basis of the MRI or PET datasets and the imaging features of interest (2); finally, we calculated the cross‐signature by combining the molecular signature and the imaging features in our dataset (3a) and the validation cohort (3b) when available. (B) Gene signature in the MRI dataset, the two identified MRI features individually, and the resulting cross‐signatures. (C) Gene signature in the PET dataset associated with SUVnorm to construct the cross‐signature. (D) The protein signature in the MRI dataset associated with the MRI feature of interest was used to construct the cross‐signature. (E) The protein signature in the PET dataset associated with the PET feature of interest was used to construct the cross‐signature.

References

    1. Molinaro AM, Taylor JW, Wiencke JK, Wrensch MR. Genetic and molecular epidemiology of adult diffuse glioma. Nat Rev Neurol. 2019;15:405‐417. doi:10.1038/s41582-019-0220-2 - DOI - PMC - PubMed
    1. Louis DN, Perry A, Wesseling P, et al. The 2021 WHO classification of tumors of the central nervous system: a summary. Neuro Oncol. 2021;23:1231‐1251. - PMC - PubMed
    1. Jooma R, Waqas M, Khan I. Diffuse low‐grade glioma: changing concepts in diagnosis and management—a review. Asian J Neurosurg. 2019;14:356‐363. - PMC - PubMed
    1. Mellinghoff IK, van den Bent MJ, Blumenthal DT, et al. Vorasidenib in IDH1‐ or IDH2‐mutant low‐grade glioma. N Engl J Med. 2023;389:589‐601. - PMC - PubMed
    1. Weller M, van den Bent M, Preusser M, et al. EANO guidelines on the diagnosis and treatment of diffuse gliomas of adulthood. Nat Rev Clin Oncol [Internet]. 2021;18:170‐186. doi:10.1038/s41571-020-00447-z - DOI - PMC - PubMed

MeSH terms