. 2025 Jul 7;222(7):e20241667.
doi: 10.1084/jem.20241667. Epub 2025 Apr 11.

Plasmodium falciparum infection induces T cell tolerance that is associated with decreased disease severity upon re-infection

Affiliations

Plasmodium falciparum infection induces T cell tolerance that is associated with decreased disease severity upon re-infection

Diana Muñoz Sandoval et al. J Exp Med. .

Abstract

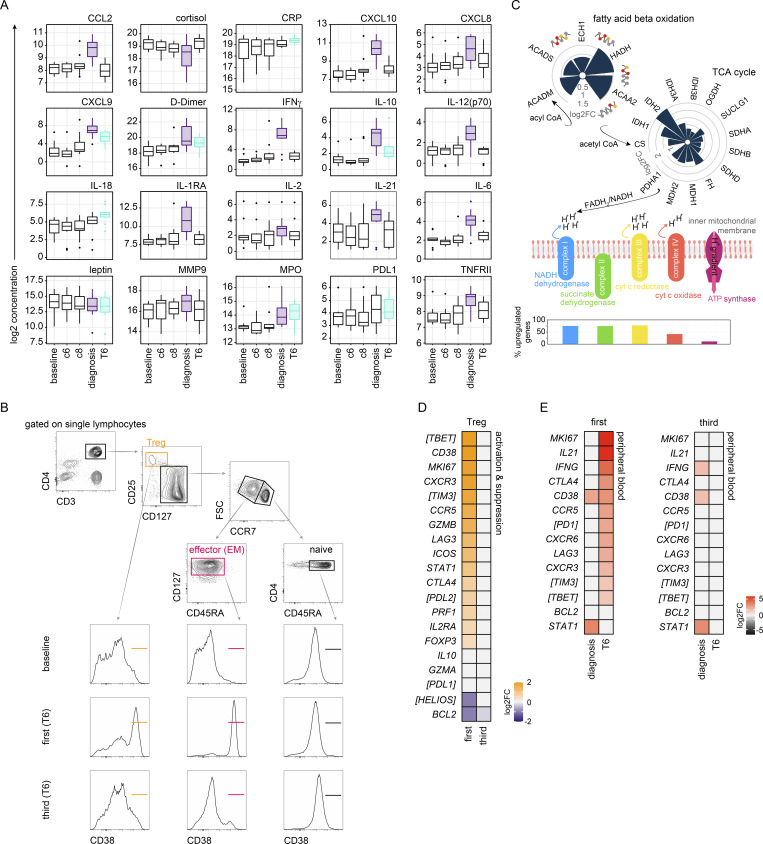
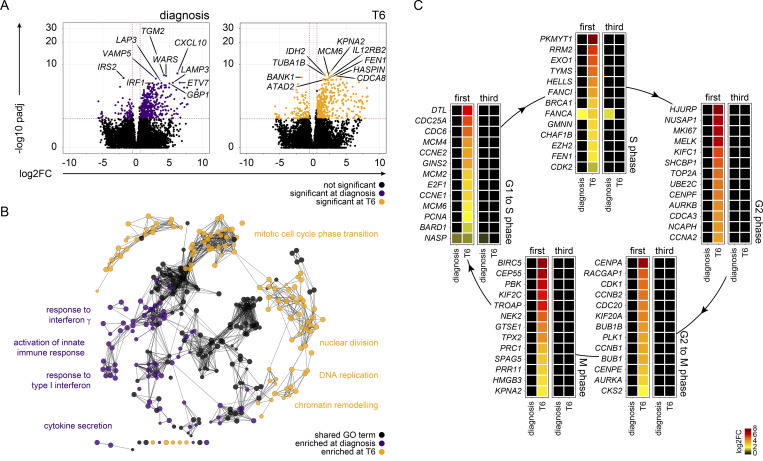
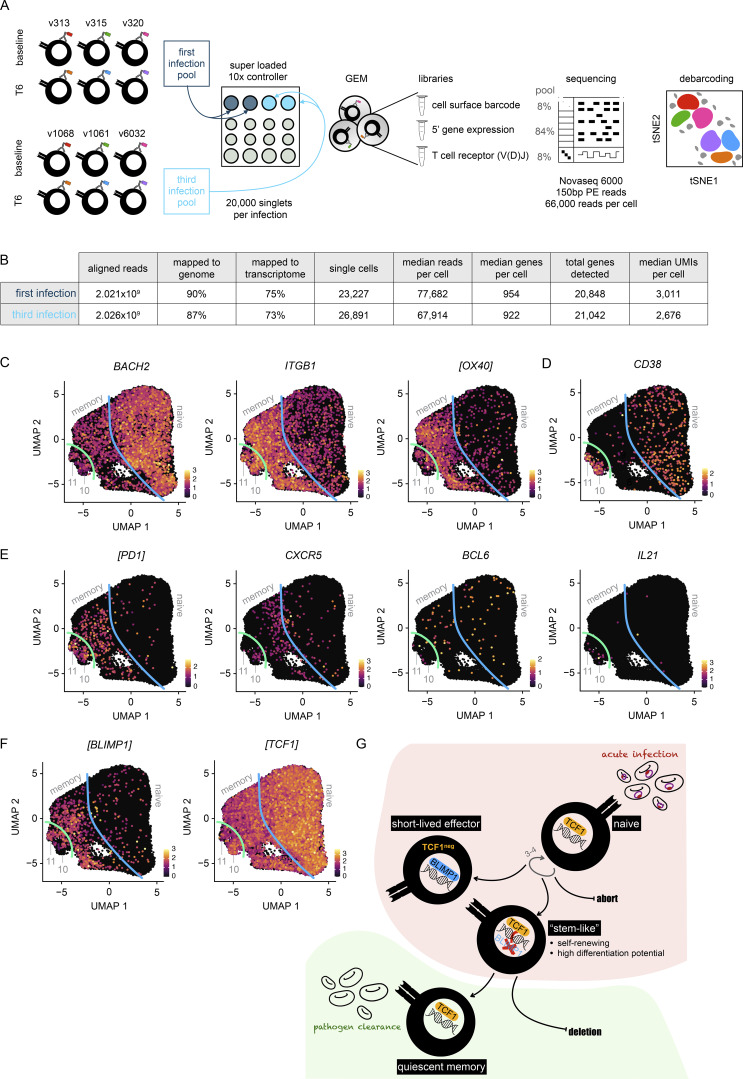
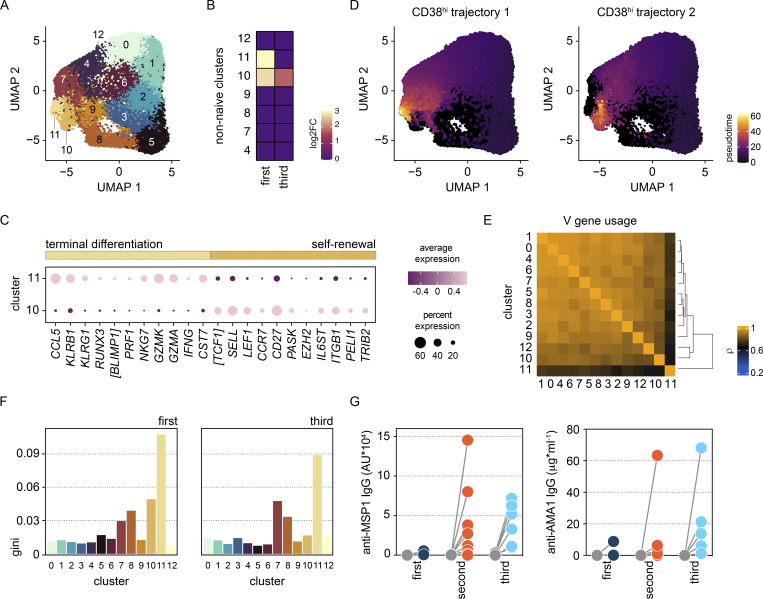
Immunity to severe malaria is acquired quickly, operates independently of pathogen load, and represents a highly effective form of disease tolerance. The mechanism that underpins tolerance remains unknown. We used a human rechallenge model of falciparum malaria in which healthy adult volunteers were infected three times over a 12 mo period to track the development of disease tolerance in real-time. We found that parasitemia triggered a hardwired innate immune response that led to systemic inflammation, pyrexia, and hallmark symptoms of clinical malaria across the first three infections of life. In contrast, a single infection was sufficient to reprogram T cell activation and reduce the number and diversity of effector cells upon rechallenge. Crucially, this did not silence stem-like memory cells but instead prevented the generation of cytotoxic effectors associated with autoinflammatory disease. Tolerized hosts were thus able to prevent collateral tissue damage in the absence of antiparasite immunity.


Conflict of interest statement

Disclosures: The authors declare no competing interests exist.

Figures

Figure S1.
Figure S1.
Systemic inflammation is not attenuated upon rechallenge. (A) Data were extracted from Gonçalves et al. (2014) to examine the frequency of severe or complicated malaria during the first 14 infections of life in infants living in a hyperendemic setting. We first plotted the total number of cases of malaria (including mild or uncomplicated episodes) and used least squares regression to impute missing values (for infection numbers 9, 11, 12, and 13). Imputed values are shown as a grey triangle whereas filled circles indicate data as reported by Gonçalves et al. The total number of children experiencing at least one episode of malaria was n = 715. (B) We next plotted the incidence of severe or complicated malaria at each order of infection (as shown in Fig. 1, A and B) and performed maximum likelihood estimation to select the best model fit for these data; log likelihood (logL) and AIC both show that an exponential decay in risk provides the best fit (SE, standard error). (C) Healthy malaria-naive adults were enrolled in the VAC063 study and infected up to three times with P. falciparum (clone 3D7) by direct blood challenge. The mean frequency of eosinophils, lymphocytes, monocytes, and neutrophils in whole blood at baseline and diagnosis is shown (note that the loss of lymphocytes at diagnosis is comparable in all three infections). (D) RNAseq was used to identify differentially expressed genes in whole blood at diagnosis (versus baseline) (adj P < 0.05 and >1.5 fold-change). Volcano plots show all differentially expressed genes (colored dots) and the dashed lines represent the significance/fold-change (FC) cutoffs. The top 10 differentially expressed genes (lowest adj P) in each infection are labeled (first, second, and third infection were analyzed independently). (E) The log2 fold-change of signature genes associated with interferon signaling and type I inflammation are shown at diagnosis (versus baseline) in the first, second, and third infection. Square brackets indicate that common protein names have been used. In C, n = 10 (first and second infection) and n = 6 (third infection). In D and E, n = 10 (first infection), n = 9 (second infection), and n = 6 (third infection). v1040 was excluded from RNAseq analysis in the second infection because their baseline sample failed QC.
Figure 1.
Figure 1.
The risk of severe malaria decreases exponentially with exposure. (A and B) Data were extracted from Gonçalves et al. (2014) to examine the frequency of severe (A) or complicated (B) malaria during the first 14 infections of life in infants living in a hyperendemic setting. We performed maximum likelihood estimation to select the best model fit for these data; the black line shows the best fit and grey shading represents the 95% confidence intervals. In both cases, an exponential decay provided a better fit than either a linear decay or constant risk. In A, n = 102 severe episodes and in B, n = 199 complicated episodes of malaria (see Fig. S1, A and B for case imputation and model performance). (C–G) Healthy malaria-naive adults were infected up to three times with P. falciparum (clone 3D7) by direct blood challenge. Repeated sampling before, during, and after each infection allowed us to track the development of disease tolerance in real-time. (C) Parasite growth curves for first, second, and third infection; each line represents a volunteer, and lines are color-coded by infection number. Parasite density was measured in peripheral blood by qPCR every 12 h. The grey box represents the lower limit of quantification (20 parasites ml−1) and the treatment threshold of 10,000 parasites ml−1 is denoted by the black line. (D and E) Maximum core body temperature (D) and minimum hemoglobin (E) were recorded during each infection (up to 48 h after treatment). Each symbol represents one volunteer with a line shown at the median. Grey shading indicates a normal range (115–165 g liter−1 hemoglobin for females and 130–180 g liter−1 hemoglobin for male volunteers). (F and G) Lymphocytes (F) and platelets (G) were quantified in circulation the day before infection (baseline), 6 days after challenge (c6), at the peak of infection (diagnosis), and ∼1 mo after drug treatment (convalescence). Boxplots show the median and interquartile range (IQR), and whiskers represent the 95% confidence intervals. Sample size (n) is 10 for the first and second infections and n = 6 for the third infection. There was no statistically significant difference between groups using a significance threshold of 5% (Kruskal–Wallis test). These data are also presented in Salkeld et al. (2022).
Figure 2.
Figure 2.
Infection triggers a hardwired innate immune response. (A) RNAseq was used to identify differentially expressed genes in whole blood at diagnosis (versus baseline) (adj P < 0.05 and >1.5 fold-change). ClueGO was then used for functional gene enrichment analysis and placed significant GO terms into functional groups by relatedness. Shown are the leading GO terms from 15 non-redundant groups with the lowest adj P value in the first infection. The same GO terms are plotted in the second and third infections (note that each infection was analyzed independently). (B) Radar plots (or three-way volcano plots) show the number of differentially expressed genes in whole blood between each infection—the left plot compares all baseline samples and the right plot diagnosis. Dashed lines represent the center point for each volcano plot, and the position of each dot relative to this line shows up- or downregulation. There were no differentially expressed genes in any of the six pairwise comparisons (adj P < 0.05 and >1.5 fold-change [FC]). (C) 39 plasma analytes were quantified before and during each infection using a highly multiplexed bead-based assay. The log2 fold-change of each analyte is shown relative to baseline on day 6 and 8 after challenge (c6 and c8, respectively) and at diagnosis. Analytes are ordered by log2 fold-change and are marked with an asterisk if they varied significantly during both the second and third (compared to first) infections (adj P < 0.05 by linear regression with Benjamini–Hochberg correction for multiple testing). In A and B, n = 10 (first infection), 9 (second infection), and 6 (third infection). v1040 was excluded from RNAseq analysis in the second infection because their baseline sample failed QC. In C, n = 9 (first and second infection) and 5 (third infection). v1040 was excluded from plasma analysis because all samples failed QC.
Figure S2.
Figure S2.
Activated T cells are released into circulation as inflammation resolves. (A) Mixed-effects models and linear regression were used to identify plasma analytes that vary significantly at diagnosis and/or T6 across the entire VAC063C dataset (all volunteers regardless of infection number). Kenward Roger approximation was used to calculate P values and multiple test correction was performed using the Benjamini–Hochberg method; significance (adj P < 0.05) is indicated by colored box plots (purple at diagnosis and turquoise at T6). Box (median and IQR) and whisker (1.5× upper or lower IQR) plots are shown with outliers as dots. (B) Gating strategy for sorting CD4+ T cell subsets during VAC063C. CD4+ T cells were sorted ex vivo (within 2 h of blood draw) into TRIzol for downstream RNAseq, and cells with a naive, effector (effector memory [EM]), or regulatory phenotype were sorted as shown at baseline and T6. Note that we did not use CD38 for sorting but subsequently used this marker to assess the level of activation within each subset at both time points. (C) RNAseq was used to analyze transcriptional regulation of fatty acid β-oxidation, the tricarboxylic acid (TCA) cycle, and oxidative phosphorylation (oxphos) in flow-sorted effector (effector memory) CD4+ T cells during first infection. The circular bar charts show the log2 fold-change (FC) of each major enzyme involved in fatty acid β-oxidation and the TCA cycle clockwise in reaction order 6 days after parasite clearance (T6 versus baseline). The vertical bar chart shows the proportion of oxphos enzymatic subunits that are transcriptionally upregulated at T6; all subunits required to form complex I to IV in the electron transport chain and ATP synthase are shown. The key molecules that connect these metabolic pathways are labeled. (D) RNAseq was used to identify differentially expressed genes in flow-sorted regulatory T cells (Treg) (CD4pos CD25hi CD127neg) in the first and third infection (T6 versus baseline) (adj P <0.05 and >1.5 fold-change). Heatmap shows the log2 fold-change of differentially expressed genes that control Treg activation and suppressor function. (E) RNAseq was used to identify differentially expressed genes in whole blood at diagnosis and T6 (relative to baseline) in the first and third infection (adj P < 0.05 and >1.5 fold-change). Signature genes associated with T cell activation, TH1 polarization, and cytokine production are shown. In A, n = 10 (3 first infection, 2 second infection, and 5 third infection). v1040 was excluded from plasma analysis because all samples failed QC. In C and D, n = 2 or 3 for the first infection (T6 and baseline, respectively) and n = 6 for the third infection (v313 was excluded at T6 because this sample failed QC). In E, n = 3 for the first infection and n = 6 for the third infection. In D and E, non-significant genes are displayed with a log2 fold-change of zero and square brackets indicate that common protein names have been used.
Figure 3.
Figure 3.
Inflammation is followed by proliferation in the circulation. (A) RNAseq was used to identify differentially expressed genes in whole blood at diagnosis and T6 (versus baseline) during first infection in the VAC063C study (adj P < 0.05 and >1.5 fold-change [FC]). Volcano plots show all differentially expressed genes (colored dots), and the dashed lines represent the significance/fold-change cutoffs. The top 10 differentially expressed genes (lowest adj P) at each time point are labeled. (B) Differentially expressed genes at T6 and diagnosis were combined for GO analysis of first infection and ClueGO was used to construct a merged functional gene ontology network. Each node represents a GO term and nodes are colored according to whether their associated genes were majoritively (>60%) derived from the diagnosis or T6 time point. GO terms that were shared between time points are shown in black. Four leading GO terms (each from a unique functional group) are labeled for each time point. (C) Heatmaps show differentially expressed genes at diagnosis and T6 (versus baseline) during first and third infection (adj P < 0.05 and >1.5 fold-change). The log2 fold-change of key genes associated with each phase of the cell cycle is shown. Non-significant genes are displayed with a log2 fold-change of zero. In A and B, n = 3 (first infection only), and in C, n = 3 (first infection) and n = 6 (third infection).
Figure 4.
Figure 4.
A single infection attenuates T cell activation. (A) The percentage of activated CD38hi effector or effector memory (EM) CD4+ T cells was analyzed by flow cytometry at baseline (grey dots) and 6 days after parasite clearance (colored dots) during the VAC063C study. Data are shown for volunteers undergoing their first, second, or third infection of life (see Fig. S2 B for gating strategies). (B) The percentage of activated CD38hi effector or effector memory CD4+ T cells at baseline (grey dots) and 6 days after parasite clearance (colored dots) during the VAC069 study. (C and D) RNAseq was used to identify differentially expressed genes in flow-sorted effector (effector memory) CD4+ T cells (T6 versus baseline) in first and third infection during VAC063C (adj P < 0.05 and >1.5 fold-change [FC]). The heatmaps in C show the log2 fold-change of markers of T cell activation and exhaustion and the master transcription factors that shape T cell fate. Non-significant genes are displayed with a log2 fold-change of zero and square brackets indicate that common protein names have been used. The stacked circular bar chart in D shows the log2 fold-change of cytokines and cytotoxic effector molecules. (E) Correlation between log10 transformed TRBV gene frequency at baseline and 28 days after challenge (convalescence) showing linear regression (black line) with 99% confidence intervals (grey shaded area). These data represent V gene usage across the entire T cell compartment and were obtained after one or two malaria episodes from volunteers who were subsequently infected for a third time during VAC063C. In A, n = 3 for the first infection, n = 2 for the second infection, and n = 6 for the third infection. In B, n = 8 for the first infection and n = 3 for the second infection. In C and D, n = 2 or 3 for the first infection (T6 and baseline, respectively) and n = 6 for the third infection (v313 was excluded at T6 because this sample failed QC). In E, n = 5 in the first and second infection (v1065 convalescence samples failed QC).
Figure S3.
Figure S3.
Activated CD4 + T cells bifurcate along the TCF1/BLIMP1 axis. (A) VAC063C single-cell RNAseq workflow: each sample of flow-sorted CD4+ T cells was barcoded using TotalSeq-C oligo-tagged antibodies; samples from all volunteers and time points were pooled (separately for first and third infection); and pooled samples were superloaded onto a 10X Chromium Controller (we aimed to capture 30,000 singlets per pool). GEMs encapsulating a single cell (or doublets) were then generated and from each GEM three libraries were produced: (1) the cell surface barcode, (2) 5′ gene expression, and (3) TCR (after amplification of the V(D)J regions). Libraries were pooled at the specified ratios and sequenced. Finally, we used PCA-based clustering to debarcode all samples and remove doublets (see Materials and methods). (B) Cell Ranger was used to align 5′ gene expression and V(D)J sequencing reads (independently for the first and third infection). Shown is the output of Cell Ranger after removing doublets and performing QC. (C–F) Data from all volunteers and time points was concatenated for UMAP analysis. The expression intensity of markers for memory (C), activation (D), and follicular helper T (TFH) cell differentiation (E) are shown across the UMAP. The blue line represents the split between naive and memory cells whereas the green line represents the split between memory and activated cells. In F, the expression intensity of the master transcription factors associated with terminal differentiation (BLIMP1) versus the maintenance of stem-like properties (TCF1) are shown. In all cases, each UMAP is equivalent to those shown in Fig. 5 (for cross-reference) and square brackets indicate that common protein names have been used. (G) Proposed model of T cell activation during a first-in-life malaria episode. The maintenance of stem-like T cells is essential for long-lived memory; this requires sustained expression of TCF1 to repress BLIMP1 and prevent the terminal differentiation of short-lived effector cells. In A–F, n = 3 for first and third infection.
Figure 5.
Figure 5.
Stem-like memory CD4 + T cells respond to rechallenge. Droplet-based single-cell RNAseq was carried out during VAC063C on flow-sorted CD4+ T cells obtained at baseline and T6 from volunteers undergoing their first or third infection of life. (A) Data from all volunteers and time points was concatenated for UMAP analysis and FlowSOM identified 13 discrete clusters of CD4+ T cells across the dataset (each given a unique color). (B) Heatmap showing the differential abundance of non-naive CD4+ T cell clusters at T6 (versus baseline) in first and third infection (FDR < 0.05). Note that non-significant clusters are shown with a log2 fold-change (FC) of zero and the identification of non-naive clusters is shown in Fig. S3 C. (C) Dot plot showing differentially expressed signature genes in clusters 10 and 11 (adj P < 0.05). Square brackets indicate that common protein names have been used. (D) Trajectory inference with Slingshot revealed clusters 10 and 11 as discrete non-overlapping endpoints of CD4+ T cell activation and differentiation (analysis was performed on concatenated data and CD38hi cells were set as the endpoint; Slingshot identified two possible non-overlapping routes). (E) Spearman correlation matrix showing shared V gene usage (TRAV and TRBV) across all CD4+ T cell clusters (the order of features was determined by unsupervised hierarchical clustering). (F) Gini plot showing the equality of V gene usage in each CD4+ T cell cluster in the first and third infection; zero denotes perfect equality, which indicates a diverse TCR repertoire. (G) Class-switched antibodies (IgG) recognizing the malaria antigens MSP1 and AMA1 were quantified in serum by ELISA at baseline (grey dots) and 1 mo after challenge (colored dots). Samples were obtained from volunteers undergoing their first, second, or third infection during VAC063A, VAC063B, and VAC063C, respectively, and these data are presented in Salkeld et al. (2022). In A–F, n = 3 for the first and third infections, whereas in G, n = 10 for first and second infections and n = 6 in third infection.
Figure S4.
Figure S4.
CyTOF dynamics of T cell cluster frequencies. (A) Heatmap showing the normalized median expression values of all markers used for clustering in each of the 49 T cell clusters identified in VAC063C. Names were assigned manually using activation, lineage, and memory markers to broadly categorize each T cell cluster; when more than one cluster was placed into the same category (e.g., activated effector memory [EM] CD4) clusters were given an accessory label to highlight their unique phenotype or property (e.g., T-betlo Eomesneg). The order of features was determined by unsupervised hierarchical clustering. (B) All T cell clusters that were differentially abundant at any time point (relative to baseline) during VAC063C. Each cluster is shown as a proportion of total CD45pos CD3pos T cells and clusters are shown in the same order as the heatmap in part (A) (left to right and top to bottom). Box (median and IQR) and whisker (1.5× upper or lower IQR) plots are shown (with outliers as dots) and significance (FDR < 0.05 and >2 fold-change) is indicated by color (dark blue for first infection and bright blue for third). In all plots, n = 3 for the first infection and n = 6 for the third infection. CM, central memory; MAIT, mucosal-associated invariant T cell; NK, natural killer; TEMRA, terminally differentiated effector memory cell re-expressing CD45RA; Treg, regulatory T cell.
Figure 6.
Figure 6.
Cytotoxic T cells are silenced for a minimum of 8 mo. Whole blood was preserved within 30 min of blood draw at baseline, diagnosis, and T6 during VAC063C as well as 45 days after challenge (convalescence). Samples were stained with a T cell–focused antibody panel (see Table S3) and acquired on a Helios mass cytometer. After the exclusion of normalization beads and doublets, we gated on CD45pos CD3pos T cells for downstream steps. (A) Data from all volunteers and time points was concatenated for UMAP analysis and FlowSOM identified 49 discrete clusters of T cells across the dataset (each given a unique color). The major T cell subsets are labeled according to the expression of lineage, memory, and activation markers. (B) UMAP showing the T cell clusters that are differentially abundant at T6 (versus baseline) in the first and third infection (FDR < 0.05 and >2 fold-change). Clusters that are not significant are shown in black. (C) The mean frequency of each T cell cluster that is differentially abundant in first and/or third infection is shown as a proportion of all CD45pos CD3pos T cells at T6. CM, central memory; DN, double negative; EM, effector memory; MAIT, mucosal-associated invariant T cell; NK, natural killer; TEMRA, terminally differentiated effector memory cell re-expressing CD45RA; Treg, regulatory T cell. (D) Pies show the relative size of each differentially abundant cluster. (E) Heatmap showing the normalized median expression values of all markers used for clustering in each of the differentially abundant T cell clusters. The order of features was determined by unsupervised hierarchical clustering. Color codes to the left of the heatmap indicate cluster identity and show whether clusters were significant in the first infection or the first and third infections. Note that no cluster was unique to third infection. In A–E, n = 3 for the first infection and n = 6 for the third infection. The gap between VAC063B and C was 8 mo.
Figure S5.
Figure S5.
Cytotoxic T cells are silenced after a single infection. (A) Stacked bar chart showing the frequency of activated (CD38hi Bcl2lo) T cells at baseline, diagnosis, and T6 as well as 45 days after challenge (convalescence) during VAC063C. Each bar represents one volunteer, and individual T cell clusters are color-coded to match Fig. 6 (note that only differentially abundant clusters are included). The major CD4+ and CD8+ T cell clusters with cytotoxic features are highlighted with a black border in the key to the left of the plot. (B) Differential marker expression through time in each major T cell subset. First, T cell clusters belonging to the same lineage were merged and then CD4+ and CD8+ T cells were split into naive, effector, effector memory (EM), and central memory (CM) subsets. Next, linear models were used to independently assess differential marker expression in each subset at each time point (relative to baseline); a shift in median expression of at least 10% and an FDR < 0.05 were required for significance. Shown are all subset/marker pairs that were called as significant at T6 and data are presented as row-wise z-score marker intensities. Color codes to the left of the heatmap indicate whether markers were differentially expressed during first infection, third infection or both infections. MAIT, mucosal-associated invariant T cell; NK, natural killer; TEMRA, terminally differentiated effector memory cell re-expressing CD45RA; Treg, regulatory T cell.
Figure 7.
Figure 7.
Controlling T cell activation protects host tissues. (A) A surrogate dataset from Reuling et al. (2018) was used to extract information on the frequency and severity of abnormal ALT during a first-in-life infection (up to 6 days after treatment). All volunteers were infected with P. falciparum (3D7 or NF54) as part of a CHMI trial that used equivalent end-points to our own study and in every case abnormal ALT was scored using the same adaptation of the WHO adverse event grading system (see Materials and methods). Data from 95 volunteers in Reuling et al. (those enrolled in the EHMI-3, LSA-3, EHMI-8B, EHMI-9, ZonMw2, TIP5, and CHMI-trans1 studies) and the three first infection volunteers in VAC063C were pooled for analysis. (B) Frequency and severity of liver injury; Barnard’s test was used to statistically determine whether an abnormal ALT reading was more prevalent during a first-in-life infection compared with the second or third infection (a P value below 0.05 was considered significant). (C) Pearson correlation matrix showing the fold-change of differentially abundant plasma analytes, lymphocytes, and hemoglobin during VAC063C. Fold-change was calculated either at diagnosis or T6 (relative to baseline) according to when this was largest for each feature. Also included are maximum parasite density, maximum core temperature (up to 48 h after treatment), and class-switched antibody titer (28 days after challenge). Finally, circulating ALT is shown at T6 together with the frequency of activated (CD38hi) effector (effector memory) CD4+ T cells, regulatory T cells, and cytotoxic T cells (defined as granzyme Bpos). All data were log2 transformed and the order of features was determined by unsupervised hierarchical clustering. (D) PBMC were isolated during VAC063C from volunteers undergoing their first infection of life, restimulated in vitro with PMA/ionomycin, and cocultured with HepG2 cells for 24 h. Cytotoxicity was measured by the release of LDH. Experiments were performed using baseline and T6 samples, and data are shown as baseline subtracted values (i.e., absorbance at T6 minus absorbance at baseline). Curves were fit using a cubic polynomial function (the shaded areas represent 95% confidence intervals). Note that LDH release was shown experimentally to be specific to HepG2 cells and all assays were run in duplicate. In A and B, n = 98 for the first infection and n = 8 for rechallenge (2 second infection and 6 third infection). In C, n = 10 (3 first infection, 2 second infection, and 5 third infection) and in D, n = 3 (first infection only).

Similar articles

Cited by

References

    1. Ademolue, T.W., Aniweh Y., Kusi K.A., and Awandare G.A.. 2017. Patterns of inflammatory responses and parasite tolerance vary with malaria transmission intensity. Malar. J. 16:145. 10.1186/s12936-017-1796-x - DOI - PMC - PubMed
    1. Antonelli, L.R., Leoratti F.M., Costa P.A., Rocha B.C., Diniz S.Q., Tada M.S., Pereira D.B., Teixeira-Carvalho A., Golenbock D.T., Gonçalves R., and Gazzinelli R.T.. 2014. The CD14+CD16+ inflammatory monocyte subset displays increased mitochondrial activity and effector function during acute Plasmodium vivax malaria. PLoS Pathog. 10:e1004393. 10.1371/journal.ppat.1004393 - DOI - PMC - PubMed
    1. Appay, V., Zaunders J.J., Papagno L., Sutton J., Jaramillo A., Waters A., Easterbrook P., Grey P., Smith D., McMichael A.J., et al. 2002. Characterization of CD4(+) CTLs ex vivo. J. Immunol. 168:5954–5958. 10.4049/jimmunol.168.11.5954 - DOI - PubMed
    1. Bach, F.A., Munoz Sandoval D., Mazurczyk M., Themistocleous Y., Rawlinson T.A., Harding A.C., Kemp A., Silk S.E., Barrett J.R., Edwards N.J., et al. 2023. A systematic analysis of the human immune response to Plasmodium vivax. J. Clin. Invest. 133:e152463. 10.1172/JCI152463 - DOI - PMC - PubMed
    1. Baird, J.K., Basri H., Weina P., MaGuire J.D., Barcus M.J., Picarema H., Elyazar I.R., Ayomi E., and Sekartuti. 2003. Adult Javanese migrants to Indonesian Papua at high risk of severe disease caused by malaria. Epidemiol. Infect. 131:791–797. 10.1017/s0950268803008422 - DOI - PMC - PubMed

LinkOut - more resources