. 2025 Apr 11;25(1):115.
doi: 10.1007/s10238-025-01629-8.

TPM4 influences the initiation and progression of gastric cancer by modulating ferroptosis via SCD1

Affiliations

TPM4 influences the initiation and progression of gastric cancer by modulating ferroptosis via SCD1

Ling-Lin Zhao et al. Clin Exp Med. .

Abstract

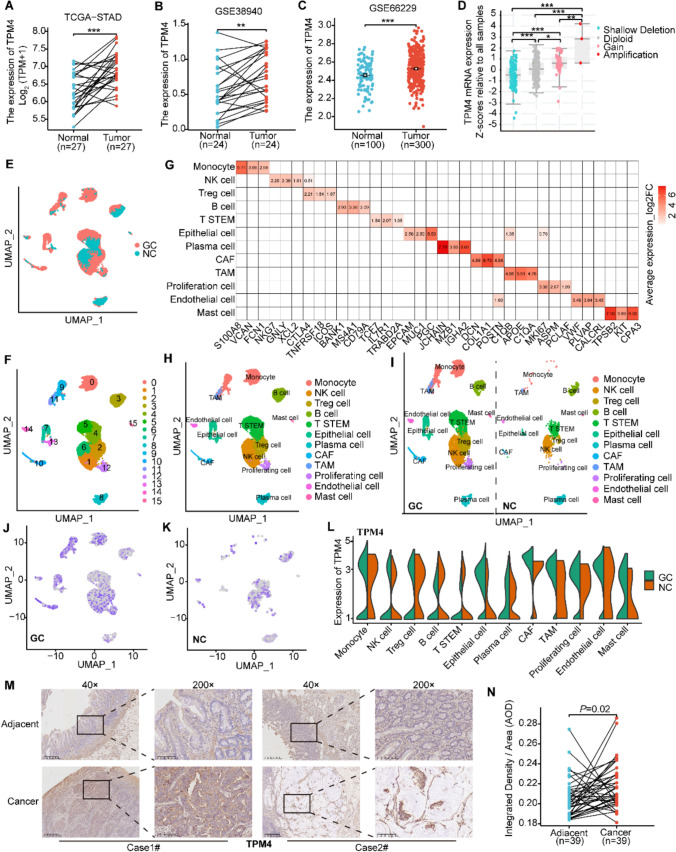
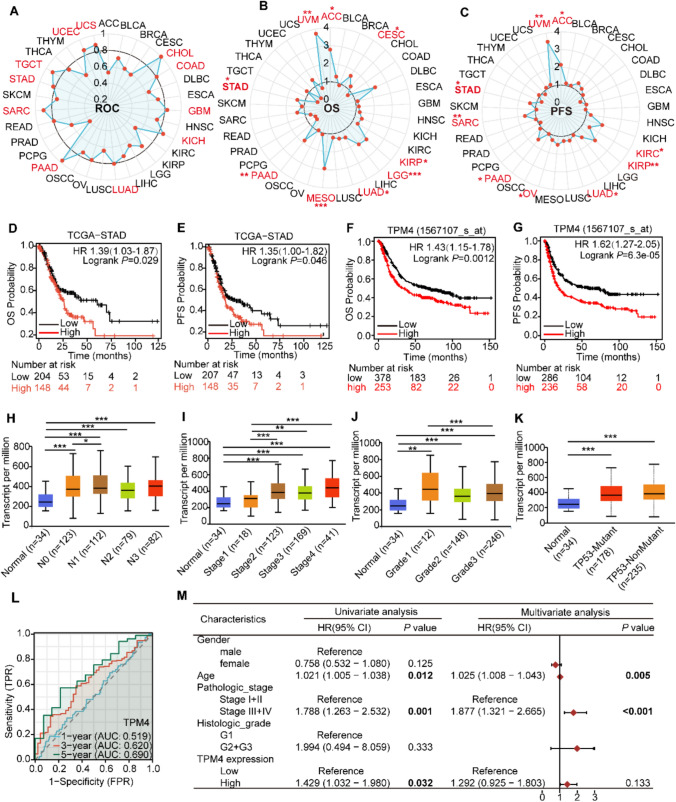
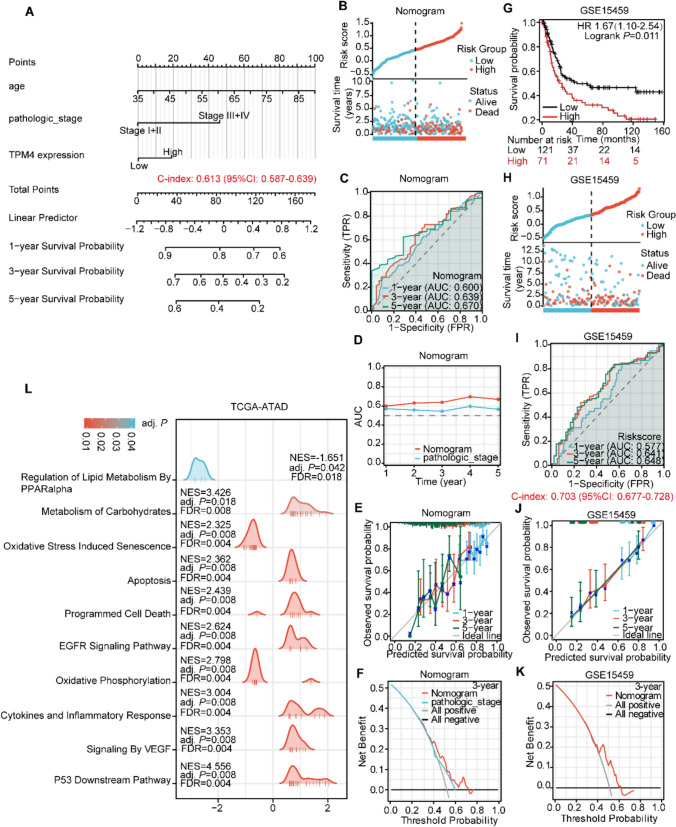
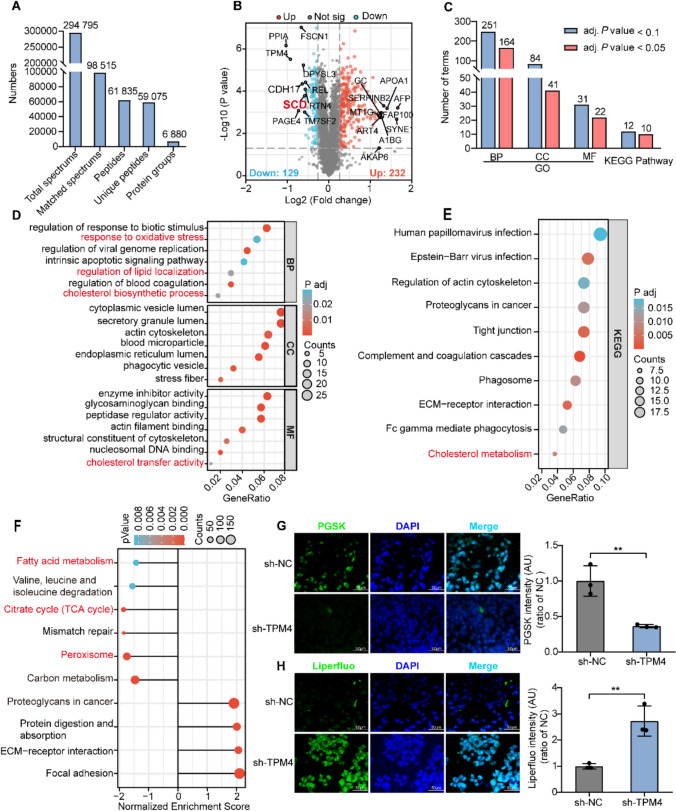
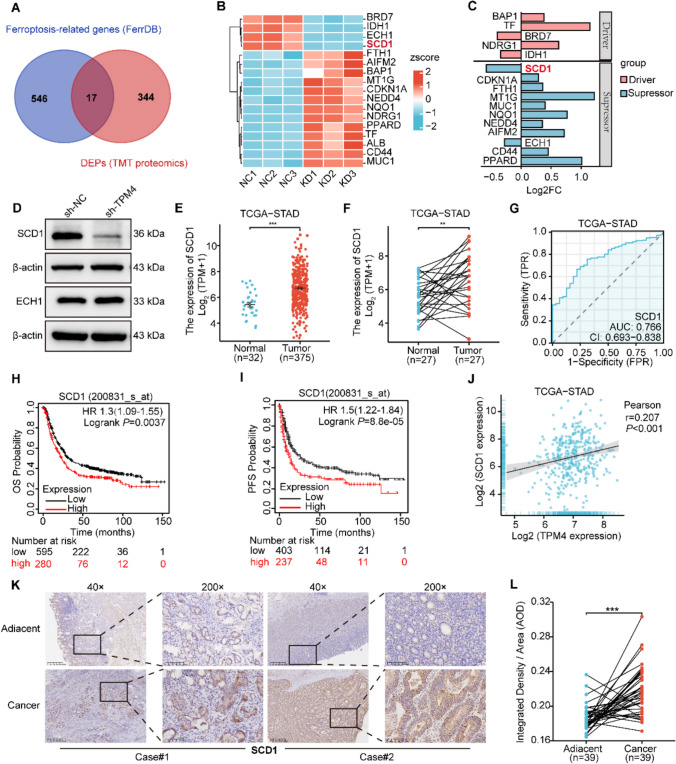
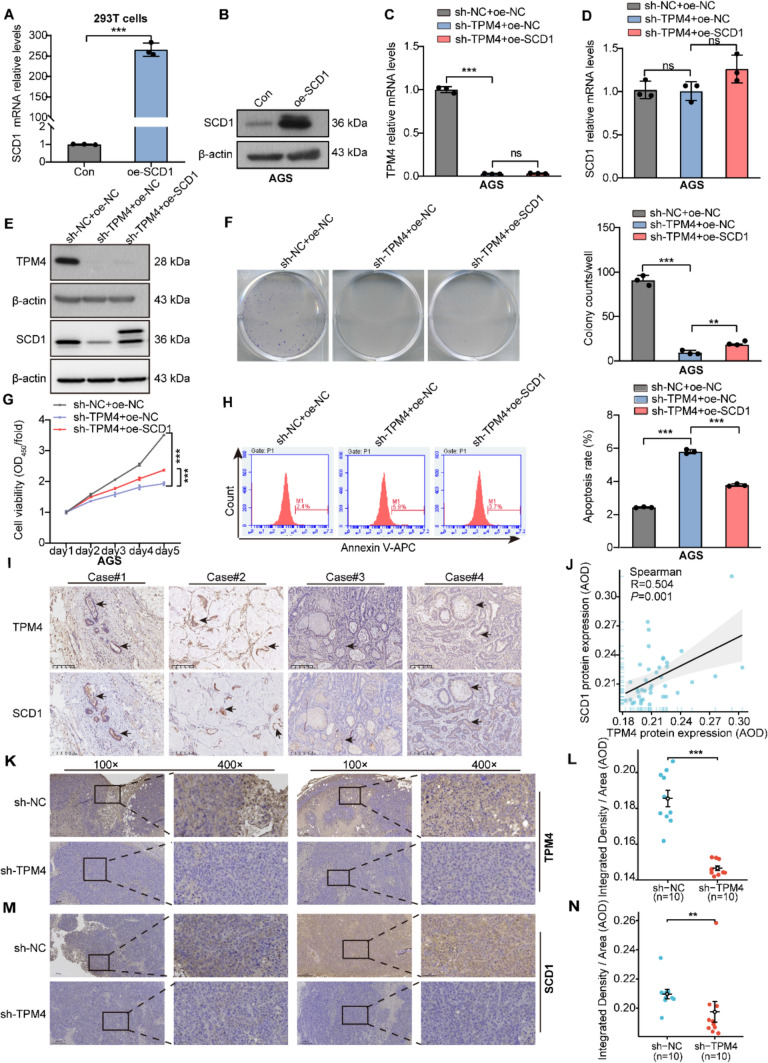
Gastric cancer (GC) is a deadly disease with poor prognosis and few treatment options. Tropomyosin 4 (TPM4) is an actin-binding protein that stabilizes the cytoskeleton of cells and has an unclear role in GC. This study aimed to elucidate the role and underlying mechanisms of TPM4 in GC pathogenesis. The expression and diagnostic and prognostic value of TPM4 in GC were analyzed using bioinformatics. A nomogram based on TPM4 expression was created and validated with an external cohort. TPM4-knockdown GC cells and xenograft models in nude mice were used to study the function of TPM4 in vitro and in vivo. Proteomic and rescue experiments confirmed the regulatory effect of TPM4 on stearoyl-CoA desaturase 1 (SCD1) in GC. Immunohistochemistry verified the expression and correlation of the TPM4 and SCD1 proteins in GC tissues. Our study identified TPM4 as an oncogene in GC, suggesting its potential diagnostic and prognostic value. The TPM4-based nomogram showed potential prognostic value for clinical use. TPM4 knockdown inhibited GC cell proliferation, induced ferroptosis, and slowed tumor growth in vivo, which is achieved by inhibiting SCD1 expression. Immunohistochemical analysis of GC tissues revealed elevated expression levels of both TPM4 and SCD1 proteins, with a positive correlation observed between their expression. TPM4 is a promising target for new diagnostic, prognostic, and therapeutic strategies for GC. Downregulation of TPM4 inhibits GC cell growth and induces ferroptosis by suppressing SCD1 expression.

Keywords: Ferroptosis; Gastric cancer; Proliferation; Stearoyl-CoA desaturase 1; Tropomyosin 4.


Conflict of interest statement

Declarations. Conflict of interest: The authors state that they possess no conflicting interests related to the material presented in this article. Ethical approval: The study was conducted in accordance with the Declaration of Helsinki and approved by the Ethics Committee at Qinghai University Affiliated Hospital (SL-2021128). The animal studies were approved by the animal ethics committee of Qinghai University (SL-2021128). Consent to participate: All tumor specimens analyzed in this study were formalin-fixed and paraffin-embedded, which had been confirmed as GC by specialist pathologist, and written consent for medical research purposes was obtained from the patients. Tissue sample collection was approved by the Ethics Committee at Qinghai University Affiliated Hospital (SL-2021128, date of sample collection approval: 2024.05).

Figures

Fig. 1
Fig. 1
TPM4 expression is upregulated in GC tissues and cells. A The expression of TPM4 was analyzed in paired gastric tumor and normal samples obtained from the TCGA-STAD database. B-C TPM4 mRNA expression was analyzed in the GSE38940 (B) and GSE66229 (C) datasets. D The connection between changes in the copy number of the TPM4 gene and mRNA expression levels in STAD was analyzed using the cBioPortal database. E-L Single-cell gene expression analysis of TPM4 from GSE163558. E Cells were categorized based on their tissue of origin, including GC and neighboring normal tissue. F A UMAP plot illustrates 16 distinct cell clusters derived from four samples. G A heat map showing the expression of signature genes across 12 different cell types. H UMAP plot of 12 distinct cell types annotated and identified. I Cell cluster distributions in the tissues of the NC and GC groups, as illustrated by the UMAP plots. J-K The distribution of TPM4 genes in each cell cluster of GC tissue (J) and normal tissue (K) is shown using UMAP. L The cell cluster expression of the TPM4 gene for the GC and NC groups is shown in a violin plot. M Representative immunohistochemical images of TPM4 expression in GC and para-carcinoma tissues are shown. DAB staining revealed that TPM4-positive cells were localized mainly in the cellular cytosol and membranes. Scale bars represent 400 μm and 100 μm, respectively. N The AOD quantitative analysis of the IHC staining for TPM4 was performed using ImageJ Fiji software (paired t test, n = 39). The data are presented as means ± SDs. *P < 0.05, **P < 0.01, ***P < 0.001
Fig. 2
Fig. 2
TPM4 expression has significant diagnostic and prognostic value across multiple cancer types. A Radar chart illustrating the ROC analyses used to assess the diagnostic significance of the TPM4 gene in various cancers within the TCGA database. The black spoke represents an AUC of 0.8. B-C Evaluation of the prognostic implications of TPM4 expression in different cancers includes analyses of OS (B) and PFS (C), derived from the TCGA database. Significant results are marked in red (P < 0.05). The radial axis of the radar map represents the HR. D-E Survival curves for OS (D) and PFS (E) among patients exhibiting high and low expression levels of the TPM4 gene in the TCGA-STAD dataset. F-G Analysis of OS (F) and PFS (G) for GC patients categorized by low and high expression of TPM4, utilizing data from the KM plot database. H–K Differential expression of TPM4 mRNA between normal tissues and tissues from GC patients with different lymph node metastasis status (H), pathological stage (I), tumor grade (J) and TP53 mutation (K) was analyzed using the UALCAN database. L Examinations of the ROC curves for OS linked to TPM4 expression in the TCGA cohort were conducted across 1-year, 3-year, and 5-year intervals. M A forest plot illustrates both univariate and multivariate Cox regression analyses regarding the levels of TPM4 expression and various clinicopathological factors. *P < 0.05, **P < 0.01, ***P < 0.001
Fig. 3
Fig. 3
Construction, assessment, and validation of the prognostic model with TCGA and GEO datasets. A Construction of a prognostic nomogram model using the TCGA cohort training set. B Distribution of the risk score, survival time, and survival status within the TCGA training dataset. C ROC curves for 1-, 3-, and 5-year survival rates were generated based on the nomogram from the TCGA training database. D The time‐dependent AUC of the nomogram was evaluated in the TCGA dataset. E Calibration plots of the nomogram were designed to predict the likelihood of OS at 1, 3, and 5 years within the TCGA training cohort. F The DCA curves were used to evaluate the clinical benefit of the nomogram models in the training database. G Kaplan‒Meier survival curves for GC patients categorized by high and low-risk scores derived from the risk model in the GEO validation cohort. H The distribution of the risk score, survival duration, and survival status within the GEO validation set. I Time‒dependent ROC analysis of the GEO validation cohort. J Calibration curve of the nomogram model in the external validation cohort. K The DCA curves of the nomogram were analyzed in the external GEO validation dataset. L GSEA was conducted on genes that were differentially expressed between the groups with low and high expression of TPM4 in the TCGA gastric cancer cohort. NES represents the normalized enrichment score; adj. P indicates the adjusted P-value; and FDR refers to the false discovery rate
Fig. 4
Fig. 4
Downregulation of TPM4 expression demonstrates enhanced antitumor effects in vivo and in vitro. A qRT‒PCR was used to detect the relative mRNA expression of TPM4 in GES-1 cells and four human GC cell lines. Groups compared with the GES-1 group. B Representative Western blots of TPM4 expression in GES-1 cells and four human GC cell lines. C The silencing efficiency of the TPM4 gene in AGS and MKN-45 cells was examined via qRT‒PCR. D TPM4 knockdown efficacy were verified in AGS and MKN45 cells via Western blotting. E–F Cell viability of AGS (E) and MKN-45 (F) cells was determined by a CCK-8 assay. G Colony formation assays were performed on AGS and MKN-45 cells. The column chart (shown below) illustrates the number of colonies formed in each cell line. H Cell apoptosis was detected by flow cytometry using Annexin V-APC. The bar chart shows the percentage of apoptosis cells. I Images of tumors produced by subcutaneous tumor formation assays in nude mice are shown. J Xenograft growth volumes were measured at various time points after subcutaneous injection in nude mice (data were expressed as mean ± SEM). K The effects of TPM4 knockdown on tumor weight in subcutaneous xenograft nude mice (n = 10) were analyzed. The data are presented as Mean ± SD from triplicate experiments. compared with the control group, **P < 0.01, ***P < 0.001. sh represents the short hairpin RNA; NC refers to the negative control
Fig. 5
Fig. 5
TMT-based quantitative proteomics and bioinformatics analysis. A Peptides and proteins were identified via TMT-based quantitative proteomics. B Volcano plot of the DEPs. Among the 361 DEPs, 129 were downregulated and 232 were upregulated (FC > 1.2 or FC < 0.833 and adj p-value < 0.05). The names of the top 10 upregulated and downregulated proteins are shown. C GO and KEGG enrichment analyses identified 164 entries related to BP, 41 related to CC, 22 related to MF, and 10 related to KEGG pathways (adj. P-value < 0.05). D The results of GO enrichment for 361 DEPs are presented in a bubble diagram. E A bubble diagram was created to display the KEGG enrichment results of these 361 DEPs. F GSEA of the KEGG pathway of TPM4 co-expressed genes in STAD was conducted using the LinkedOmics database. G Representative confocal images of AGS cells treated with sh-NC and sh-TPM4, labeled with the fluorescent probe PGSK (green) and DAPI-stained nuclei (blue). The fluorescence of PGSK is inversely proportional to the level of intracellular labile iron. Scale bar: 50 μm. Bar graphs represent the mean fluorescence intensity in arbitrary units (AUs). H LPO accumulation in sh-NC/sh-TPM4 AGS cells was detected using Liperfluo (L248) and photographed via fluorescence microscopy. The nuclei and LPO were stained with DAPI and L248, respectively. Scale bar: 50 μm. Results are presented as Mean ± SD of triplicate experiments, compared to the control group, **P < 0.01
Fig. 6
Fig. 6
Knocking down TPM4 can inhibit the expression of the ferroptosis-related gene SCD1. A A Venn diagram illustrating the DEPs identified through TMT-based proteomics, alongside those associated with ferroptosis, shows that seventeen candidate proteins were found in the intersection. B Distribution of the sample and 17 candidate DEGs. C Expression trends of 17 ferroptosis-related DEPs according to the TMT proteomic results. Among them, three ferroptosis drivers were upregulated (BAP1, TF, and NDRG1), whereas two ferroptosis suppressors were downregulated (SCD1 and ECH1). D Western blotting confirmed that the knockdown of TPM4inhibited the expression of the SCD1 protein but did not suppress the expression of ECH1. E The expression levels of SCD1 in GC tissues and normal gastric tissues were analyzed using data from the TCGA database. F A comparison of SCD1 expression in paired normal and GC tissues from the TCGA cohort. G Diagnostic value of the SCD1 gene in the TCGA-STAD cohort was conducted. H-I High SCD1 expression levels correlate with poor OS (H) and PFS (I) outcomes in GC patients, according to the KM plot database. J Correlation analysis of TPM4 and SCD1 in STAD (TCGA). K Exemplary immunohistochemical images demonstrating SCD1 protein expression in GC and adjacent non-cancerous tissues. DAB staining revealed that SCD1-positive cells were localized mainly in the cellular cytosol and membranes. Scale bars represent 400 μm and 100 μm, respectively. L Statistical analysis of the results of immunohistochemical DAB staining of SCD1 was performed by calculating the AOD values using a paired t test (n = 39). The data are presented as means ± SDs, and experiments were repeated in triplicate. Comparisons were made with the control group, with**P < 0.01 and ***P < 0.001
Fig. 7
Fig. 7
TPM4 influences the malignant behavior of GC by regulating SCD1. A The efficiency of SCD1 overexpression was validated in 293 T cells via qRT‒PCR. B AGS cells were infected with the oe-SCD1 lentivirus, and the SCD1 protein was detected via WB. CD qRT‒PCR assessment of TPM4 (C) and SCD1 (D) mRNA expression in AGS cells infected with sh-TPM4 lentivirus or co-transfected with oe-SCD1 lentivirus. E Representative bands of TPM4 and SCD1 protein expression in each group were detected using Western blotting. Note: Two bands were observed in the OE-SCD1 group: the lower band was identified as endogenous SCD1 (approximately 37 kDa), and the higher band represented exogenous FLAG-tagged SCD1 (approximately 39.7 kDa). F Overexpression of SCD1 reversed the inhibitory effect of TPM4 knockdown on cell colony formation. The bar diagrams indicate the number of clones in each group. G. SCD1 overexpression reversed the inhibition of AGS cell proliferation caused by TPM4 silencing. H The rescue effect of SCD1 overexpression on cell apoptosis induced by TPM4 knockdown in AGS cells. The bar chart on the right shows the percentage of apoptosis cells. I Representative immunohistochemical images showing the consistency of TPM4 and SCD1 protein expression in GC tissues. Scale bar: 200 μm. J Scatter plot showing the correlations between TPM4 and SCD1 protein expression in GC tissues (n = 39, Spearman correlation test). K-L Immunohistochemistry images illustrating the expression of TPM4 proteins in xenograft tumors (K) and a statistical scatter plot are presented(L). M–N Representative immunohistochemical images (M) and statistical scatter plots (N) of SCD1 protein expression in xenograft tumors are shown. Scale bars represent 200 μm and 50 μm, respectively. Results are presented as Mean ± SD of triplicate experiments, in comparison with the control group: *P < 0.05, **P < 0.01, ***P < 0.001. ns: no statistical significance. OE: overexpression

Similar articles

References

    1. Sung H, Ferlay J, Siegel RL, Laversanne M, Soerjomataram I, Jemal A, et al. Global cancer statistics 2020: GLOBOCAN estimates of incidence and mortality worldwide for 36 cancers in 185 Countries. CA Cancer J Clin. 2021;71(3):209–49. 10.3322/caac.21660. - PubMed
    1. Gao K, Wu J. National trend of gastric cancer mortality in China (2003–2015): a population-based study. Cancer Commun (Lond). 2019;39(1):24. 10.1186/s40880-019-0372-x. - PMC - PubMed
    1. Van Cutsem E, Sagaert X, Topal B, Haustermans K, Prenen H. Gastric cancer. Lancet. 2016;388(10060):2654–64. 10.1016/S0140-6736(16)30354-3. - PubMed
    1. Bang YJ, Van Cutsem E, Feyereislova A, Chung HC, Shen L, Sawaki A, et al. Trastuzumab in combination with chemotherapy versus chemotherapy alone for treatment of HER2-positive advanced gastric or gastro-oesophageal junction cancer (ToGA): a phase 3, open-label, randomised controlled trial. Lancet. 2010;376(9742):687–97. 10.1016/S0140-6736(10)61121-X. - PubMed
    1. Caporali S, Calabrese C, Minieri M, Pieri M, Tarantino U, Marini M, et al. The miR-133a, TPM4 and TAp63gamma role in myocyte differentiation microfilament remodelling and colon cancer progression. Int J Mol Sci. 2021. 10.3390/ijms22189818. - PMC - PubMed

MeSH terms

LinkOut - more resources